


The live Bitcoin (BTC) price chart provides a dynamic view of market action, showing how traders and investors are positioning in real time. By studying Bitcoin price charts, you can identify momentum shifts, price patterns, and future trading opportunities with BTC technical analysis.
BTC Live Price Chart Overview
As of the latest data, BTC is trading at $87,569.26 USD, with a -2.45% change over the last 24 hours. Its trading volume stands at not specified in recent data, supported by a market capitalization of $1,748,114,488,139 USD.
- Current Price: $87,569.26 USD
- 24H Range: $85,500 – $90,472.45
- Market Rank: #1
The Bitcoin price chart shows Bitcoin returning to weekly lows below $86,000 amid volatility, with recent support tests suggesting cautious trader positioning ahead of December's mixed seasonal patterns.
Intraday & 1-Week Chart Insights
On the 1-week Bitcoin price chart, BTC has traded between $85,500 and $92,750, covering a price range of approximately 8%. This range highlights whether the token is trending strongly or moving sideways.
Recent candles indicate consolidation with bearish pressure, as BTC slipped below key supports like $90,124, potentially eyeing deeper retests unless buyers defend $80,400.
How to Read the BTC Price Chart
Understanding the Bitcoin chart requires looking at several components:
- Candlesticks: These reveal market sentiment, with patterns like hammers, engulfing candles, or dojis often signaling shifts in momentum.
- Moving Averages (MA): Short- and long-term MAs show whether momentum is bullish, bearish, or neutral.
- Volume Trends: Spikes or drops in trading activity often precede major moves.
- Trendlines/Channels: These highlight long-term direction, whether BTC is in an uptrend, downtrend, or consolidating.
Key Technical Indicators (Dynamic)
Technical indicators add another layer of BTC technical analysis to the chart:
- RSI (Relative Strength Index): Near oversold levels post-17% November drop → indicates whether BTC is overbought, oversold, or neutral.
- MACD (Moving Average Convergence Divergence): Signals momentum shifts when the MACD line crosses the signal line.
- Bollinger Bands: Show volatility — compressed bands often precede big breakouts, while wide bands highlight ongoing volatility.
Bearish signals dominate with BTC below the bear flag lower band, but a liquidity sweep to $66,800-$80,400 could precede recovery if ETF inflows resume.
Historical Price Levels for BTC
Looking at Bitcoin price history helps put today's price in context:
- All-Time High (ATH): Not specified in recent data on Not specified
- All-Time Low (ATL): Not specified in recent data on Not specified
Comparing BTC's current price with these extremes highlights how far the token has come — and how much room there might still be for growth.
Support & Resistance Zones
Support and resistance zones are critical for traders using BTC technical analysis:
- Support Levels: $80,400, $85,000
- Resistance Levels: $90,124, $97,100
Support at $80,400 has acted as a rebound zone but remains fragile, while resistance near $97,100 could cap rallies unless volume confirms a breakout.
Conclusion
The BTC price chart offers more than just numbers — it reveals trader psychology, market patterns, and potential future moves. By combining candlestick patterns, volume data, and technical indicators through comprehensive BTC technical analysis, traders can make more informed decisions.
To keep track of the latest movements, check the live Bitcoin price chart on MEXC, where real-time data and trading opportunities are always available.
Description:Crypto Pulse is powered by AI and public sources to bring you the hottest token trends instantly. For expert insights and in-depth analysis, visit MEXC Learn.
The articles shared on this page are sourced from public platforms and are provided for reference only. They do not represent the position or views of MEXC. All rights belong to MEXC. If you believe any content infringes upon the rights of a third party, please contact service@support.mexc.com for prompt removal. MEXC does not guarantee the accuracy, completeness, or timeliness of any content and is not responsible for any actions taken based on the information provided. The content does not constitute financial, legal, or other professional advice, nor should it be interpreted as a recommendation or endorsement by MEXC. For expert insights and in-depth analysis, visit MEXC Learn.
Latest Updates on Bitcoin
View More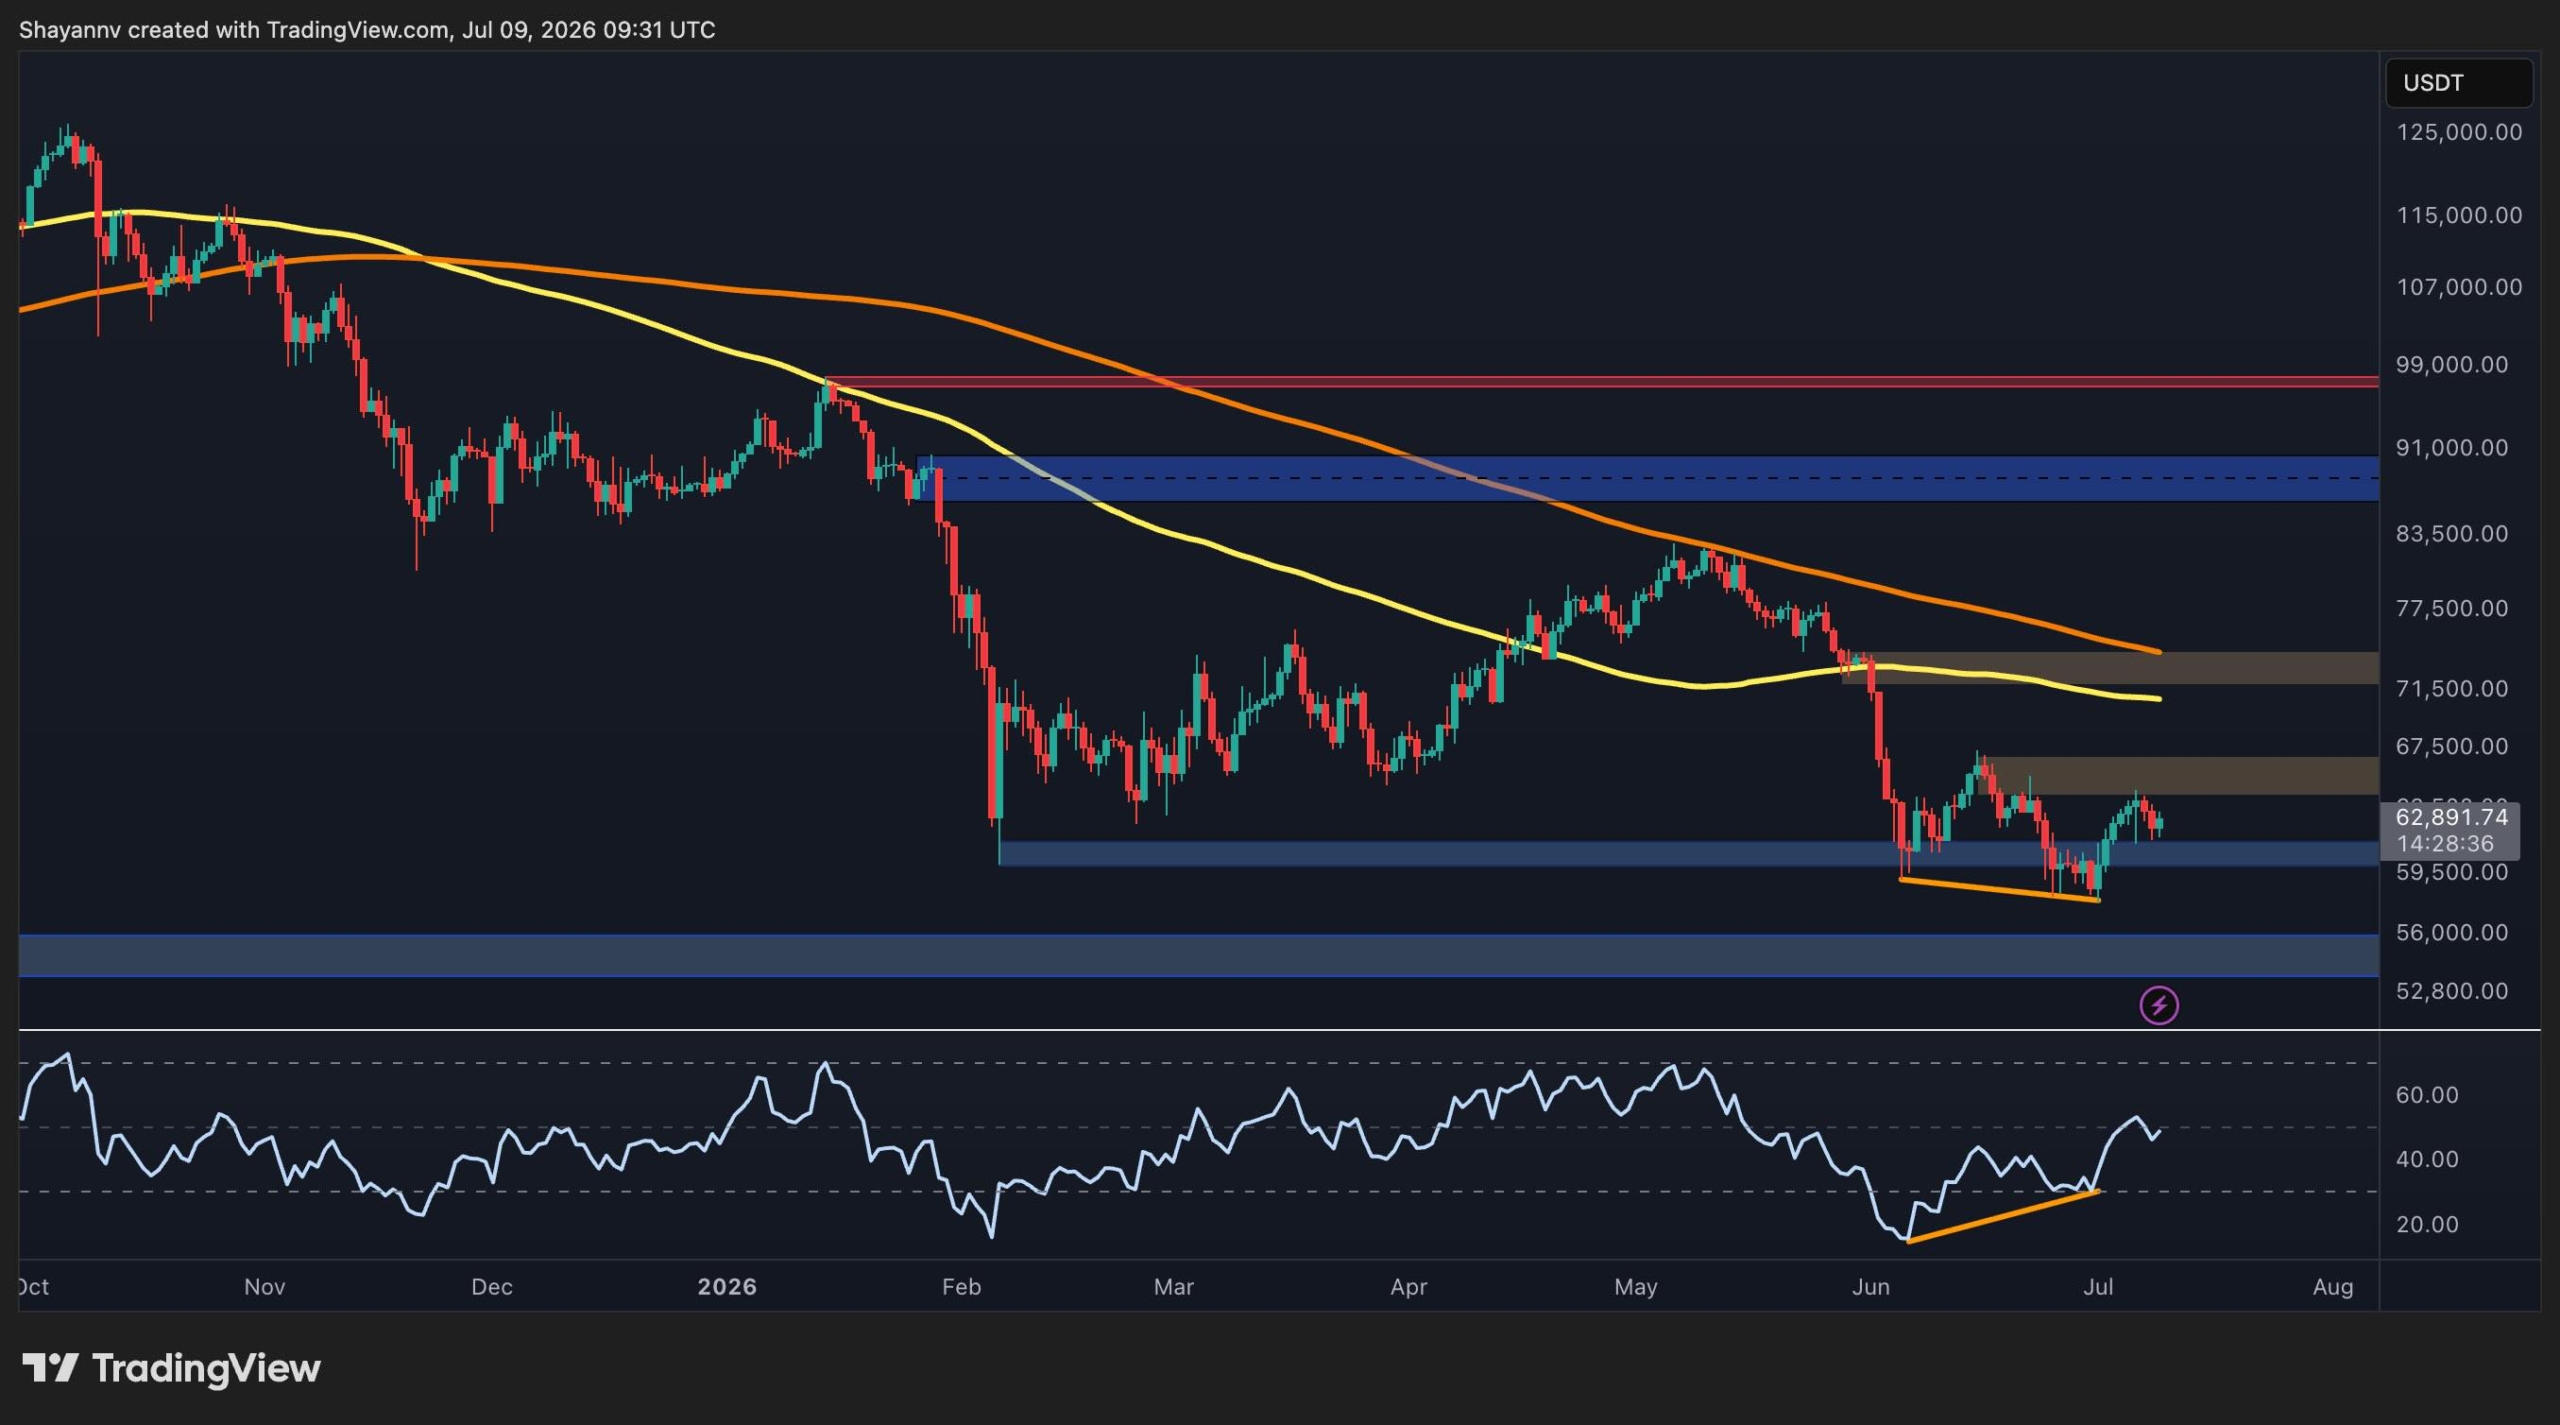
Bitcoin Price Analysis: Has BTC Cleared the Danger Zone After $64K Surge?

JPMorgan Says Bitcoin’s Bigger Risk Is Permissioned Blockchains

JPMorgan Warns: Private Bank Blockchains Threaten Bitcoin (BTC) More Than Strategy Sales


HOT
Currently trending cryptocurrencies that are gaining significant market attention
Crypto Prices
The cryptocurrencies with the highest trading volume
Newly Added
Recently listed cryptocurrencies that are available for trading