

Bitcoin RSI Plunges to COVID-Crash Levels: What History Suggests Next
BitcoinWorld
Bitcoin RSI Plunges to COVID-Crash Levels: What History Suggests Next
Bitcoin’s daily Relative Strength Index (RSI) has dropped to 15.5, a level not seen since the COVID-19 pandemic crash in March 2020. The reading, flagged by Cointelegraph, places the leading cryptocurrency in deeply oversold territory, a condition that historically has preceded significant price recoveries.
What the RSI Reading Means
The RSI is a momentum oscillator that measures the speed and change of price movements on a scale of 0 to 100. A reading below 30 is generally considered oversold, suggesting that an asset may be undervalued and due for a reversal. At 15.5, Bitcoin is far below that threshold, indicating extreme selling pressure.
According to Cointelegraph’s analysis, similar RSI readings occurred during the March 2020 COVID crash and in February 2026, each followed by rallies of 50% and 30%, respectively. While past performance is not a guarantee of future results, the pattern has drawn attention from traders and analysts monitoring the market for signs of a bottom.
Key Support Levels to Watch
The analysis emphasizes the importance of the $60,000 support level. If Bitcoin can hold this price point, there is a high probability that it could reclaim its 20-day exponential moving average (EMA) near $70,650 within a few weeks. This would represent a recovery of roughly 17% from current levels.
However, the outlook is not without risk. If the $60,000 support is breached again, the analysis suggests Bitcoin could fall to the mid-$50,000 range, a level that would test the resolve of long-term holders and potentially trigger further liquidation events.
Context and Market Implications
The current downturn comes amid a broader risk-off sentiment in global markets, driven by regulatory uncertainty and macroeconomic pressures. Bitcoin’s correlation with traditional risk assets like tech stocks has been notable in recent months, meaning that broader market conditions could influence its trajectory.
For investors, the extreme RSI reading offers a data point, but not a guarantee. The cryptocurrency market remains volatile, and sudden shifts in sentiment can occur rapidly. The key takeaway is that while technical indicators suggest a potential rebound, the market’s direction will ultimately depend on whether key support levels hold and whether broader market conditions stabilize.
Conclusion
Bitcoin’s RSI at 15.5 is a historically significant signal, echoing the depths of the 2020 COVID crash. While past rebounds offer a template, the current environment is unique, with different macroeconomic and regulatory factors at play. Traders and investors should watch the $60,000 support level closely, as it will likely determine the short-term direction of the market.
FAQs
Q1: What is the RSI and why is a reading of 15.5 significant?
A: The Relative Strength Index (RSI) is a technical indicator that measures the magnitude of recent price changes to evaluate overbought or oversold conditions. A reading of 15.5 is extremely oversold, meaning the asset has been sold off heavily and may be due for a price reversal. It is the lowest level since the COVID-19 crash in March 2020.
Q2: Does a low RSI guarantee a Bitcoin price rebound?
A: No. While historically, such low RSI readings have preceded significant rallies (50% in March 2020 and 30% in February 2026), technical indicators are not predictive guarantees. Market conditions, sentiment, and external factors like regulation and macroeconomic trends also play a critical role.
Q3: What is the 20-day EMA and why is it important?
A: The 20-day exponential moving average (EMA) is a short-term trend indicator that smooths out price data to identify the direction of the trend. Reclaiming the 20-day EMA, currently near $70,650, would signal a shift from a bearish to a more neutral or bullish short-term trend for Bitcoin.
This post Bitcoin RSI Plunges to COVID-Crash Levels: What History Suggests Next first appeared on BitcoinWorld.


You May Also Like
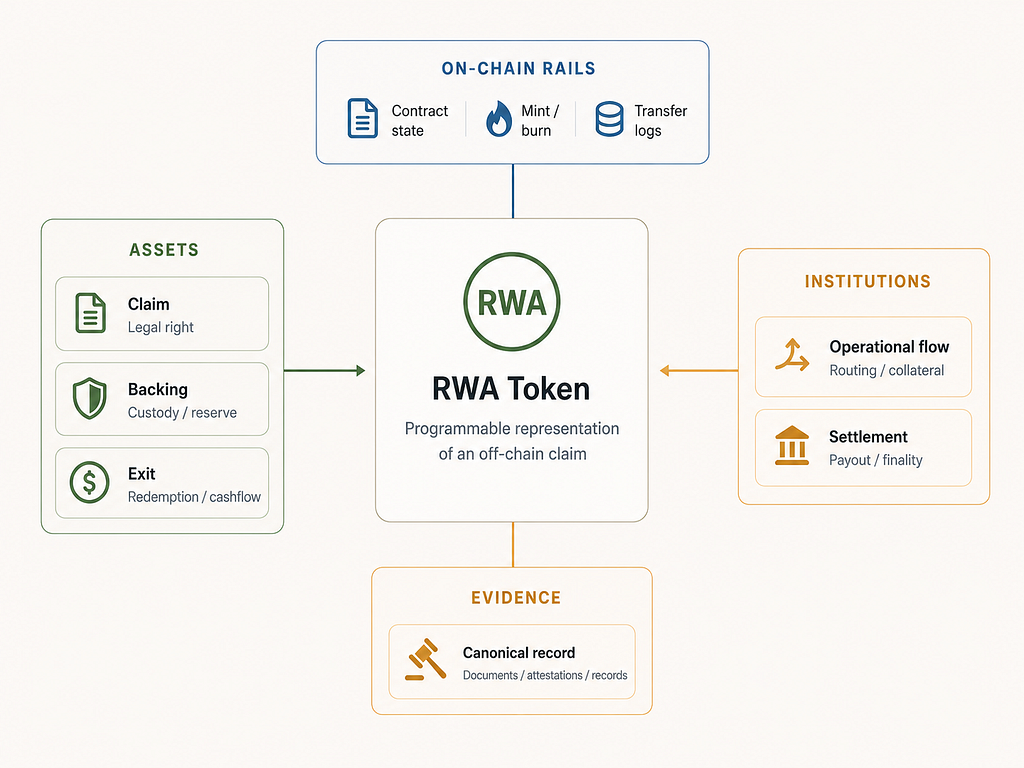
When Real-World Assets Move On-Chain, What Becomes Visible?
World Cup Memecoin WORLDCUP Surges 130% Ahead of June Tournament

XRP or Stellar (XLM): The One Asset Smart Investors Would Choose


