

Bitcoin Price Today: Every Rally Fails Near $64K, Fear Hits 15

Markets that try to find their footing and fail tell a clearer story than any indicator. As of June 18, 2026, Bitcoin price today hovers near $63,985, reflecting a market still under firm bearish control. The brief mid-June recovery has already evaporated, leaving sellers in charge of every attempted rally.
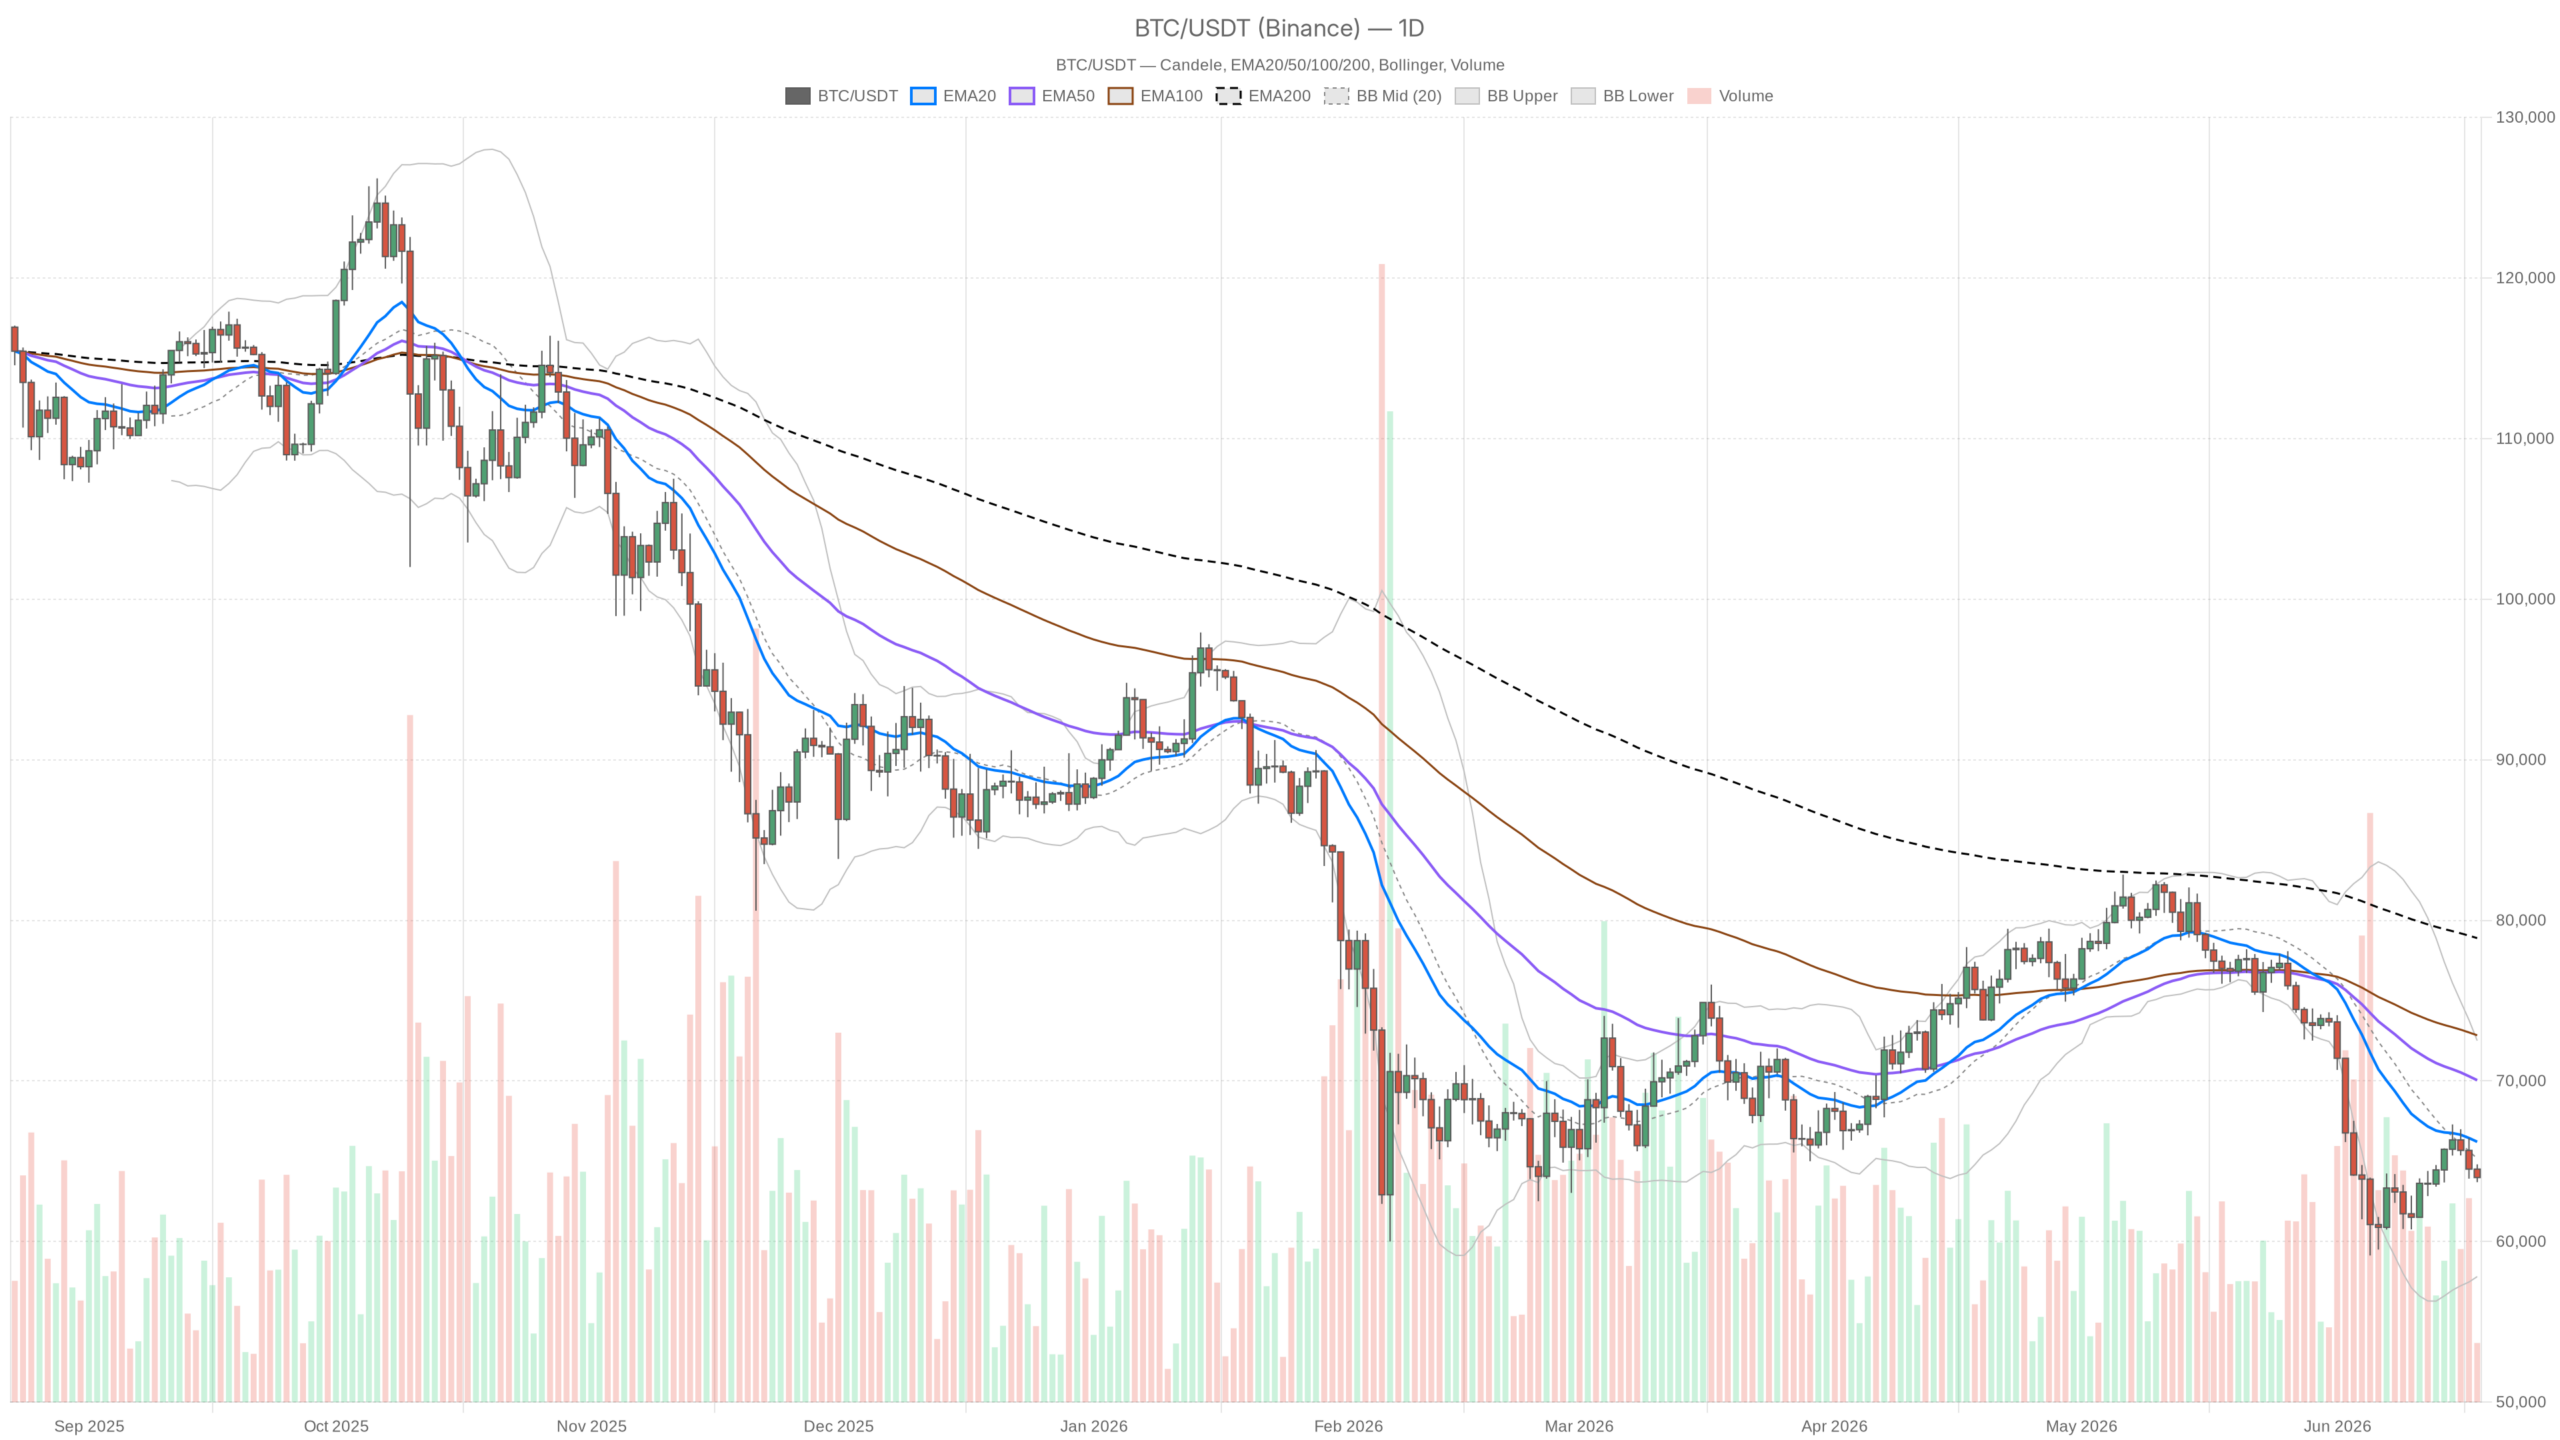 BTC/USDT — daily chart with candlesticks, EMA20/EMA50 and volume.
Key takeaways
- Bitcoin trades at $63,985 with bearish EMA alignment across all major timeframes
- The Fear & Greed Index has plunged to 15, signaling Extreme Fear among market participants
- Daily RSI at 37.35 confirms bearish control without yet reaching capitulation extremes
- Reclaiming the $64,162 daily pivot is the first checkpoint for any bullish reversal attempt
- The MACD histogram turning positive hints at decelerating momentum despite a negative structure
Bitcoin’s dominance at 56% while total crypto market cap slips 1% in 24 hours tells a clear story. Bitcoin price today reflects a market where capital is leaving the space broadly, and BTC is simply losing less than altcoins. That is not bullish — it is just the least ugly house on a bad street.
The brief two-week high posted on June 15, sparked by the US-Iran Hormuz deal, has already faded. What looked like the start of a recovery leg now reads more like a dead-cat bounce that exhausted itself before reaching any meaningful resistance. The dominant force right now is not buyers with conviction — it is sellers defending every attempted rally.
The Fear & Greed Index has clocked in at 15 — Extreme Fear — confirming the crowd is already deeply pessimistic. Historically, that zone sets the stage for contrarian moves. However, sentiment alone never stops a structural downtrend. Price confirmation is needed, and right now, it is absent.
The Daily Chart: Bearish Structure with Flickers of Hope
The daily chart confirms an unambiguously bearish structure, with Bitcoin trading below every major moving average while momentum indicators show weakness without capitulation. Price at $63,985 sits below the 20-day EMA ($66,210), below the 50-day EMA ($70,043), and well below the 200-day EMA ($78,894). That full EMA stack in bearish alignment — with price underneath all three — is about as clean a downtrend signature as you will find. Each of those moving averages now acts as resistance on any bounce attempt.
The RSI on the daily sits at 37.35 — oversold territory, but not yet at the kind of washed-out extremes that have historically marked cycle bottoms. It is weak enough to confirm the bears are in control, yet not so extreme that a capitulation low is imminent. There is room for more downside before the chart looks truly exhausted.
The MACD line at -2,355 remains deeply negative. However, the histogram has printed a positive reading of +558, meaning the bearish momentum is decelerating. This is not a buy signal — the line and signal are both still negative — but it does suggest the selling pressure is losing some steam. Think of it as the market taking a breath, not turning around.
Bollinger Bands place price near the lower half of the range. The midline sits at $65,163 and the lower band at $57,817, with the upper band up at $72,509. Price hugging the lower half of the bands in a downtrend is normal behavior. It simply reinforces that BTC is not in a range expansion phase right now. Instead, it is grinding lower within a contracted volatility envelope. The ATR of $2,262 still implies meaningful daily swings.
Daily pivot analysis shows the pivot point at $64,162, with R1 at $64,628 and S1 at $63,518. Price is hovering just below the daily pivot — a fragile no-man’s-land. Reclaiming $64,162 with some conviction would at least give bulls a short-term talking point. Losing $63,518 opens the door toward the $62K–$61K area with minimal structural support in between.
The 1H Timeframe: A Neutral Coil
The hourly chart shows a neutral regime where bears retain a short-term edge, but the trend has lost clear direction and is coiling for its next move. The 1H close at $63,994 sits below the 20 EMA ($64,524) and 50 EMA ($64,999), which confirms the bears still have the upper hand. Moreover, the 200 EMA on the 1H is at $64,437 — price is also below that level, and the EMA stack is tangled rather than cleanly aligned. That is typical of a market transitioning, not trending.
The 1H RSI at 38.43 mirrors the daily — soft, not capitulated. The MACD on the hourly is technically positive on the histogram (+4), but barely. It is the kind of reading that means the decline has paused, not reversed. Bollinger Bands on the 1H show price near the lower third of the channel, with the midline at $64,604 acting as the immediate ceiling for any recovery attempt.
15-Minute Chart: Short-Term Pressure Returns
The 15-minute chart has re-entered bearish territory, with short-term bounce attempts running out of steam as sellers reassert control near the $64K level. The MACD histogram has turned negative at -26.18 — a meaningful shift after the brief hourly stabilization. Price is below all three EMAs on this timeframe: 20 at $64,243, 50 at $64,378, and 200 at $65,080. RSI at 37 mirrors the weakness seen across all timeframes. For anyone watching for an entry, this is not a timeframe screaming to buy the dip right now.
The Bullish Scenario
A bullish recovery demands a daily close above $64,628 (R1 pivot), followed by a reclaim of the $65,163 Bollinger midband on the daily. If that happens, the next test is the 20-day EMA at $66,210. Sustained trade above that level would flip short-term momentum and give bulls a legitimate structural argument. The MACD histogram divergence and the Extreme Fear reading are the seeds of this scenario. Markets in extreme fear with decelerating bearish momentum have historically been the precondition for sharp recoveries.
A catalyst — macro relief, institutional buying, or a significant geopolitical development — could accelerate this quickly given how compressed sentiment is. That said, this scenario gets invalidated if price fails to hold $63,518 (daily S1) on a closing basis. A confirmed break below that level reopens the path toward the $61K–$60K range, and the bull case gets pushed out significantly in time.
The Bearish Scenario
The default scenario, given current structure, is continuation. Price sits below every major EMA on the daily, RSI is in the low 30s, and market cap is bleeding 1% per day. This is the anatomy of a bear phase, not a correction. The next meaningful support below current levels is the $61,000–$60,000 area. Below that, the lower Bollinger Band at $57,817 becomes the bearish target if panic sets in. With ATR at $2,262, a move from $64K to $60K could realistically unfold over two to three trading sessions under sustained pressure.
This scenario gets complicated if the Fear & Greed Index continues to hold at extreme fear levels while price stabilizes. That divergence between sentiment and price historically precedes snapback rallies. Watch for any daily candle that closes convincingly above the $64,600–$65,000 zone. That is the first sign the bears are losing control of the narrative.
Reading the Room
According to Binance market data, Bitcoin is in a structurally weak position — there is no honest way to frame it otherwise. The timeframes are mostly aligned to the downside, the EMA structure is bearish at every level, and sentiment is in the gutter. Nevertheless, gutter-level sentiment in a market showing decelerating momentum is not a setup to aggressively short either. It is a setup that demands patience.
Volatility remains elevated with an ATR above $2,200, which means position sizing matters enormously here. The gap between the current price and the 200-day EMA ($78,894) is vast — more than $14,000. Closing that gap would require a sustained multi-week recovery that the current structure simply does not support yet. Traders watching this market need to respect the primary trend, monitor the key pivots, and wait for the market to show its hand before committing in either direction. The chart is at a crossroads, and the next two to three daily closes will likely define the near-term trajectory.
FAQ
What is the current Bitcoin price level?
Bitcoin is trading at approximately $63,985 as of June 18, 2026. The price sits below all major daily moving averages, with the 20-day EMA at $66,210 and the 200-day EMA at $78,894.
What does the Fear & Greed Index at 15 mean?
A reading of 15 places the market in Extreme Fear territory, indicating widespread pessimism among participants. Historically, such levels have preceded contrarian rallies, though sentiment alone does not stop a structural downtrend without price confirmation.
What are the key support levels for Bitcoin right now?
The immediate support sits at the daily S1 pivot of $63,518. Below that, the $61,000–$60,000 area represents the next meaningful support zone. In a panic scenario, the lower Bollinger Band at $57,817 would become the bearish target.
Is Bitcoin’s current market structure bullish or bearish?
The structure is unambiguously bearish on the daily timeframe. Price trades below the 20-day, 50-day, and 200-day EMAs in a clean bearish alignment. However, the MACD histogram has turned positive, suggesting bearish momentum is decelerating rather than accelerating.
&
Disclaimer: This article is for informational purposes only and does not constitute financial advice, an investment recommendation, or a solicitation to buy or sell any financial instrument or cryptocurrency. The analysis provided is not indicative of future results. Investing in crypto assets and financial markets carries a high risk of capital loss. Always do your own research (DYOR) and consult a qualified financial advisor before making any decision.
Article produced with the assistance of artificial intelligence and reviewed by the editorial team.


You May Also Like

SoFi Launches Big Business Banking to Power Fiat and Crypto Banking on a Single Regulated Platform

Decrypt Media Highlights Europe’s Crypto Firms — Are They Facing a Squeeze?

Aave Partners with Sky Ecosystem as Initiative Launches


