-
BTC has followed historical correction cycles that previously lasted around 426-427 days.
-
Major demand zones are identified between $25,900-$30,350 and near $44,413.
-
Multiple indicators including MACD and AO continue signaling bearish pressure.
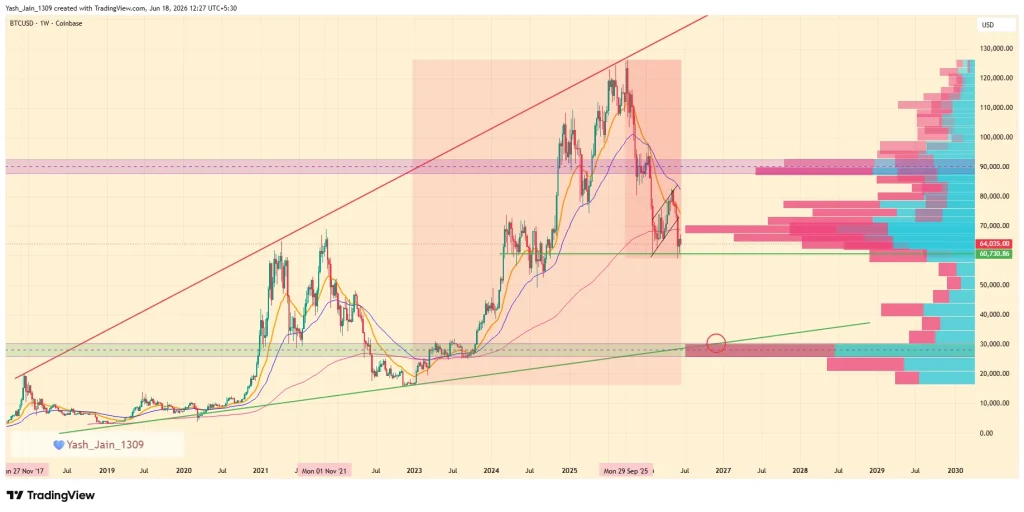
The optimism surrounding Bitcoin price has taken a serious hit in 2026, and the charts aren’t exactly offering much comfort. After reaching an all-time high near $126,296 in October 2025, the market entered a correction phase that appears to be following a historical pattern with uncomfortable precision.
What’s making traders nervous isn’t merely the decline itself. Instead, it’s the striking similarity to previous bear market cycles. The first major correction from the $21,000 peak lasted 427 days, while the decline following the $69,000 cycle top stretched 426 days. If this rhythm remains intact, the current downturn could continue until around December 2026.
Historical Cycles Point Toward Deeper Decline
The latest sell-off accelerated after BTC failed to reclaim the critical $87,800-$92,950 range. Meanwhile, the break below the $68,740-$70,062 support zone shifted market structure significantly. According to the anchored volume profile, once that region flipped into resistance, downward pressure intensified.
Of course, markets rarely move in straight lines. The rally toward $82,151 in early May initially looked encouraging. However, it ultimately became another relief rally within a broader correction, giving sellers fresh opportunities to re-enter the market.
Consequently, the broader trend remains under scrutiny as traders search for signs of a sustainable bottom.
Massive Demand Zone Sits Much Lower
Looking ahead, the most notable demand area appears between $25,900 and $30,350. This zone previously attracted strong institutional interest and also aligns with the lower boundary of the long-term ascending broadening wedge.
Interestingly, historical bear markets have produced progressively smaller percentage drawdowns. The decline following the 2017 cycle reached 87.25%, while the 2022 crash measured 78.65%.
Applying the same trend suggests the current correction could produce a 70%-76% decline from the 2025 peak. That would place BTC somewhere between approximately $30,000 and $38,000. Alternatively, another trendline structure suggests a possible bottom near $44,413, representing a 65% decline from the all-time high.

Indicators Flash Warning Signs Again
Technical indicators aren’t offering much reassurance either. The weekly RSI is showing a developing divergence similar to the one seen between June and December 2022. However, the signal appears incomplete at present, reducing confidence in an immediate bullish reversal.
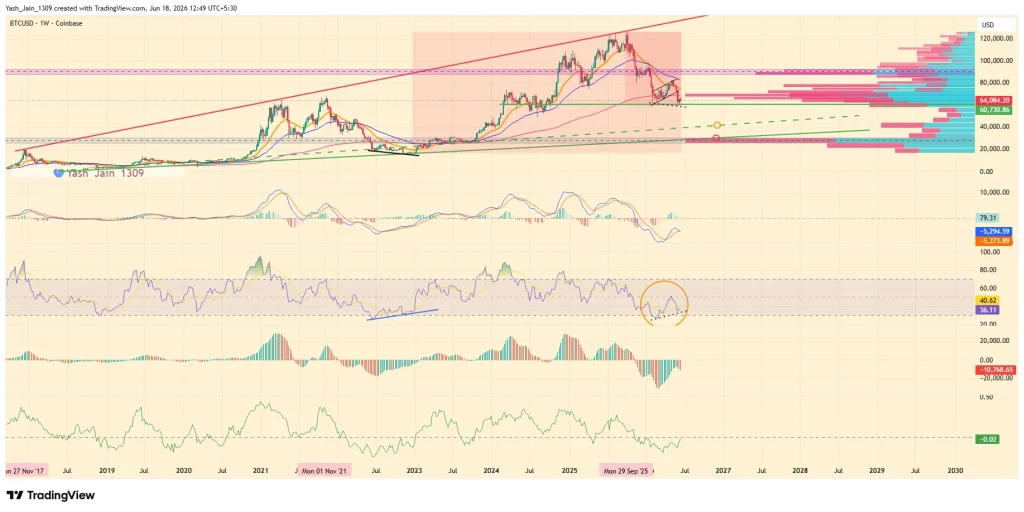
Meanwhile, the MACD is approaching a bearish crossover. At the same time, the Awesome Oscillator continues printing a downward histogram, indicating expanding selling pressure.
Furthermore, the Chaikin Money Flow recently recovered to -0.02 during the latest relief rally. Yet that level could also become a launching point for renewed downside momentum if sellers regain control.
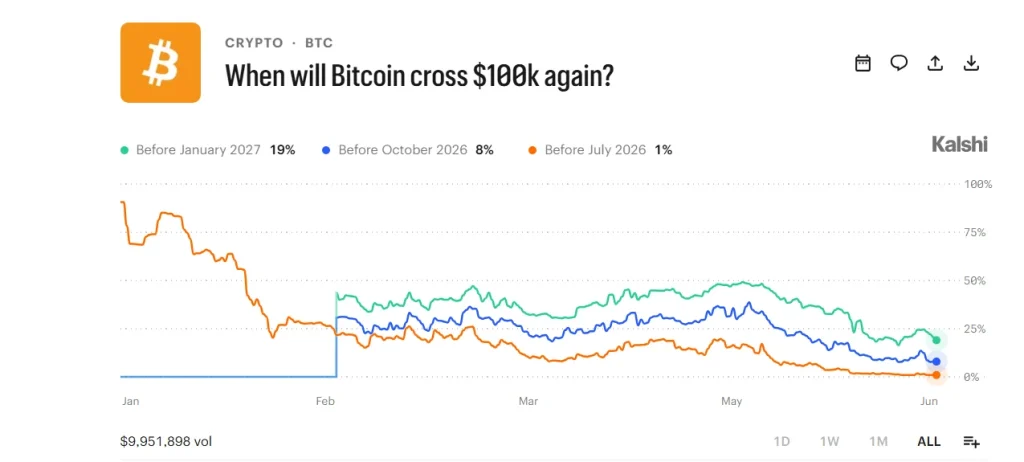
Adding another layer to the cautious outlook, prediction market sentiment has deteriorated sharply. On Kalshi’s market tracking when BTC could reclaim $100,000, expectations have fallen substantially. July 2026 odds dropped from 21% in April to just 1%, while January 2027 expectations declined from 49% in May to 19%.
Taken together, the current Bitcoin price structure suggests the correction may still be unfolding rather than ending. If the historical cycle remains intact, December 2026 could become the most important month of the entire bear market, potentially marking the final test before a new accumulation phase begins and the next major recovery emerges in 2027.