

United Airlines Is Up About 28% in Three Months as Oil Plunges: What a $152 Target Means for Investors
Key Stats for United Airlines Stock
- Current Price: $118.32
- Target Price (Mid): ~$152
- Street Target: ~$132
- Potential Total Return: ~28%
- Annualized IRR: ~6% / year
- Earnings Reaction: -5.58% (April 21, 2026)
- Max Drawdown: -27.50% (March 30, 2026)
Now Live: Discover how much upside your favorite stocks could have using TIKR’s new Valuation Model (It’s free) >>>
What Happened?
United Airlines Holdings (UAL) spent April being punished for a problem it did not create, and is now being rewarded for that same problem going away. On June 15, crude oil plunged about 5% to roughly $80 a barrel after the US and Iran reached a framework to end their war, with a formal signing scheduled for June 19. UAL rose about 3.85% that session to close near $120. The stock now trades at $118.32, up roughly 28% from its March quarter-end and just below its 52-week high of $124.79.
That round trip is the whole debate. In April, the bears had a clean story: war sent jet fuel soaring, United cut guidance, and the stock fell. The bulls argued the spike was temporary and the airline underneath was stronger than ever. The June framework is the first hard evidence that the bulls were right about the cause. What it cannot yet settle is whether the recovery is fully priced at $118, or whether real room remains to a TIKR mid-case near $152.
The Fuel Shock That Started It, and the Deal That Eased It
The setup was brutal. In its June 7 release, the International Air Transport Association (IATA), the global airline trade body, nearly halved its 2026 industry profit forecast to $23 billion from $45 billion. United felt it directly. Reporting Q1 2026 on April 21, the company cut full-year adjusted EPS guidance to $7-$11 from $12-$14, citing a $340 million jump in quarterly fuel costs. The stock fell 5.58% that day, even though revenue of $14.6 billion and adjusted EPS of $1.19 both beat estimates.
Then the catalyst reversed. The reopening of the Strait of Hormuz and the framework sent West Texas Intermediate crude to its lowest in three months. Airlines led the relief rally, and United outpaced both Delta and American on June 15. For a business where fuel is the highest variable cost, the message was immediate: the headwind that forced the April cut is easing.
What Kirby Said the Recovery Looks Like
This matters beyond a one-day pop because of what CEO Scott Kirby said at Bernstein’s Strategic Decisions Conference on May 27, which we covered in our breakdown of his $182 bull case. Kirby tied the recovery directly to oil, saying the path to 100% fuel-cost recovery, where higher fares fully offset higher fuel, gets shorter as crude falls: “the 100% ought to be moving closer moving forward just because oil prices have come down.”
That is the link the market is now trading. Kirby also said he is “increasingly confident that 2027 will be double-digit pretax margins,” adding that “nothing special needs to happen” to get there. TIKR consensus supports the direction: EBITDA is estimated to recover from around $7.6 billion in 2026 to roughly $10 billion in 2027, with normalized EPS estimated to jump from around $9 to around $14 over the same span.
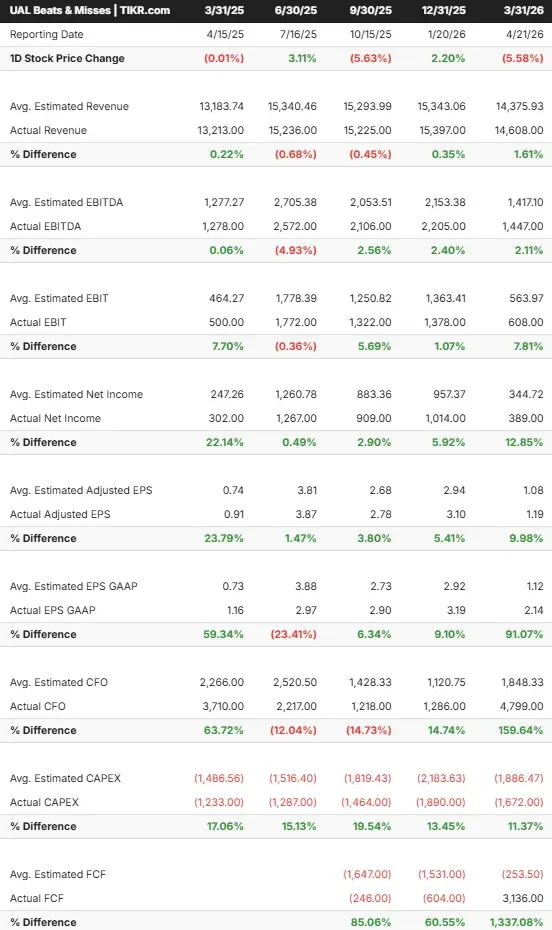 United Airlines Beats & Misses (TIKR)
See historical and forward estimates for United Airlines stock (It’s free!) >>>
Is the Recovery Already in the Price?
Here is the tension at $118. When the stock traded near $102 in early June, the TIKR mid-case implied roughly 40% upside. After a sharp rally, that same model now implies around 28%, because the market has already closed part of the gap. The recovery the bears doubted in April is becoming consensus, and consensus is partly paid for.
What keeps the upside alive is what is not yet priced. Kirby has been explicit that loyalty is the largest untapped lever. He called the Chase partnership “a decade old” while rivals have modernized theirs, and said United expects to “double the EBITDA in that particular business” on top of the core airline. MileagePlus revenue grew 13% in Q1 2026, and none of that doubling shows up in today’s NTM P/E near 12.85x.
The risk runs through the same variable that just helped. If the framework frays or oil reverses, the math runs backward. Free cash flow is estimated to fall to around $1.25 billion in 2026 from $2.56 billion in 2025, and net debt stood at $16.8 billion against a 1.31x net debt/EBITDA ratio. The $4-wide 2026 guidance range is the company’s own signal that fuel makes the year hard to call. Kirby did not dodge it: “We are confident that this one way or another will be temporal.” The June framework is the first proof point, not the last one investors will need.
 United Airlines Drawdowns (TIKR)
See how United Airlines performs against its peers in TIKR (It’s free!) >>>
TIKR Advanced Model Analysis
- Current Price: $118.32
- Target Price (Mid): ~$152
- Potential Total Return: ~28%
- Annualized IRR: ~6% / year
 United Airlines Advanced Valuation Model (TIKR)
See analysts’ growth forecasts and price targets for United Airlines stock (It’s free!) >>>
Using the mid-case, the model targets approximately $152, implying around 28% total return and a roughly 6% annualized IRR from today’s price. The two revenue CAGR drivers are international recovery, with United’s Atlantic and Pacific segments together generating about $18.5 billion in 2025 revenue, and both growing, and loyalty scaling as MileagePlus modernizes. The margin driver is fuel normalization, lifting the net income margin toward around 7% in the mid-case. The primary risk is a prolonged or renewed fuel spike.
The upside is that lower oil plus loyalty doubling leaves United with more earnings power than it entered the cycle with, making the Street’s roughly $132 target look low. The downside is that a fraying deal re-spikes fuel, compressing margins and straining the balance sheet. The $152 mid-case sits well above the Street but far below Morgan Stanley’s Street-high $182, which assumes the full loyalty, margin, and re-rating chain all land.
Conclusion
The framework answered the question that broke this stock in April. The next answer comes in mid-July, when United reports Q2 2026. Watch one number: whether full-year adjusted EPS guidance holds at $7-$11 or moves up. If management raises the floor as oil falls, the 2027 double-digit-margin call gets real, and $118 will look early. If guidance stays flat or the fuel relief gets hedged away in cautious language, the 28% run will have front-run a recovery that still needs proof. Kirby has been right about United’s structure for years. July tests the timing.
See what stocks billionaire investors are buying so you can follow the smart money with TIKR.
Should You Invest in United Airlines?
The only way to really know is to look at the numbers yourself. TIKR gives you free access to the same institutional-quality financial data that professional analysts use to answer exactly that question.
Pull up United Airlines, and you’ll see years of historical financials, what Wall Street analysts expect for revenue and earnings in the quarters ahead, how valuation multiples have moved over time, and whether price targets are trending up or down.
You can build a free watchlist to track United Airlines alongside every other stock on your radar. No credit card required. Just the data you need to decide for yourself.
Analyze United Airlines on TIKR Free →
Looking for New Opportunities?
- See what stocks billionaire investors are buying so you can follow the smart money.
- Analyze stocks in as little as 5 minutes with TIKR’s all-in-one, easy-to-use platform.
- The more rocks you overturn… the more opportunities you’ll uncover. Search 100K+ global stocks, global top investor holdings, and more with TIKR.
Disclaimer:
Please note that the articles on TIKR are not intended to serve as investment or financial advice from TIKR or our content team, nor are they recommendations to buy or sell any stocks. We create our content based on TIKR Terminal’s investment data and analysts’ estimates. Our analysis might not include recent company news or important updates. TIKR has no position in any stocks mentioned. Thank you for reading, and happy investing!


You May Also Like

Q2 Market Insights: Bitcoin regains dominance in risk-averse environment, ETFs remain critical to market structure

How to Avoid Crypto Scams: A Complete Guide for Beginners

If You’re 50+ and Tired of Watching Tech Boom Without You, Read This


