

Gold Price Just Flashed a Signal Bulls Have Been Waiting Months For!
Gold briefly dipped below $4,000 per ounce for the first time in eight months. On June 24, spot gold fell to an intraday low of approximately $3,973.79, breaking below the psychological $4,000 level for the first time since November 2025.
However, it looks like $4,000 is now acting as support. The price bounced briefly here. At press time, gold is trading at around $4,060 per ounce.
The decline has been brutal. From its January record high near $5,595 an ounce, gold has now crashed more than 28%, approaching the 30% correction that some analysts had been expecting.
But one economic analyst sees this as a signal, not a death knell.
Martin A. Armstrong: The Computer Model Predicted This Washout
Martin A. Armstrong, an economic analyst known for his computer models and cycle analysis, posted a tweet that caught my attention.
He wrote: “Gold has now fallen below $4,000 an ounce for the first time since November 2025, and suddenly everyone is proclaiming the bull market is dead.”
He pointed out the exact numbers. On June 24, spot gold fell to an intraday low of approximately $3,973.79, breaking below $4,000 for the first time in seven months. On June 25, gold remained under pressure, trading around $3,982.49. From its January record high near $5,595 an ounce, gold has now declined more than 28%, approaching the 30% correction his computer models had been pointing toward.
His key insight: “Markets move in cycles, not straight lines. A correction of this magnitude frightens the late buyers into dumping their positions at precisely the time our computer indicated this washout would unfold.”
In other words, the correction was expected. The panic is the signal. The late buyers are selling at the bottom.
What Was Pushing Gold Lower
The dominant late-June story was bearish for gold in the short term. Markets repriced interest-rate expectations after Fed communication, which lifted yields and the dollar and made non-yielding gold less attractive.
Reuters said gold was heading for a fourth straight weekly loss as hawkish Fed bets buoyed the dollar. CNBC noted that gold hovered near a more than seven-month low because expectations of U.S. rate hikes were weighing on prices.
The safe-haven bid was fading by the end of the month, even as some geopolitical risk still helped at times, especially around U.S.-Iran tensions.
What Was Supporting Gold
Despite the short-term pressure, structural support remained. China’s central bank kept adding to gold reserves in May – the 19th consecutive month of purchases. That remained a key source of demand.
Reuters also said softer bond yields and lower energy prices could eventually ease pressure on the Fed and support gold later.
The medium-term picture is still supported by central-bank buying and macro uncertainty.
Read also: Gold and Silver Prices Crash May Be Over; Robert Kiyosaki Says a Long Rally Could Be Next
Gold Chart Analysis: The 200-Day MA Looms Large
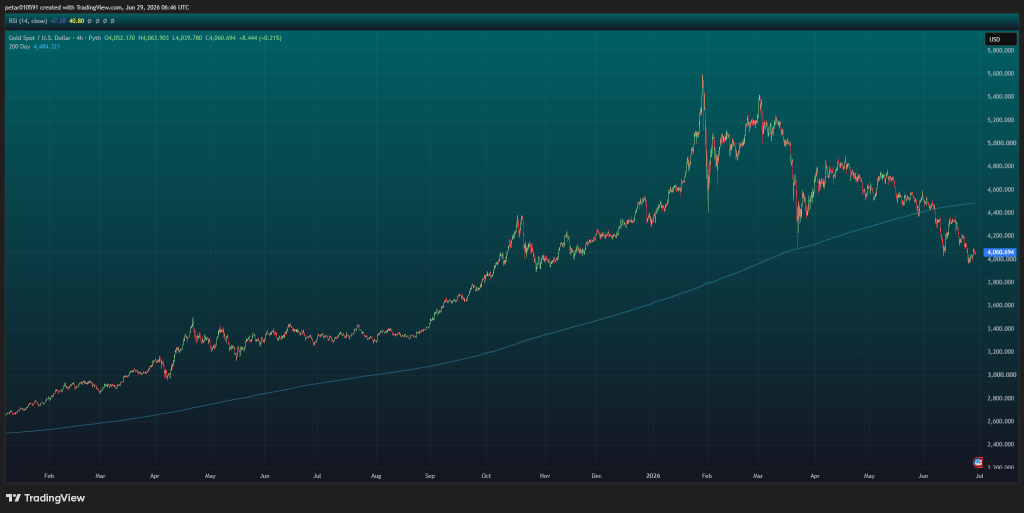
The attached TradingView chart shows gold on the 4‑hour timeframe.
Price action: Gold is trading at $4,060.69 after bouncing from the $3,973 low. The price has formed a descending channel since the January peak near $5,600. The current bounce is testing the upper boundary of that channel.
 Source: TradingView
200‑day moving average: The 200‑day MA sits at $4,484.32 – more than $400 above the current price. This is a massive gap. Gold has not traded above its 200‑day MA since mid‑June. That is a sign of a strong bear trend.
RSI (14): The RSI reads 47.28 on the 4‑hour chart. That is neutral to slightly bullish, as it has moved up from the 40.80 reading earlier. But it is not oversold. The previous oversold reading near 40 means selling pressure has eased, but buyers have not yet taken full control.
Support: $4,000 is the immediate psychological support. Below that, the next major support is $3,800 – the level Armstrong’s computer model pointed toward as the 30% correction target.
Resistance: $4,150 is the first resistance. Above that, $4,300 and the 200‑day MA at $4,484 are the major levels to reclaim.
Gold Price Prediction for the Rest of 2026
Based on my research, here are current gold price predictions for the rest of 2026:
Short‑term (July–August 2026): Gold is likely to consolidate between $4,000 and $4,300. The $4,000 level is acting as support for now. But if the Fed remains hawkish and the dollar stays strong, a break below $4,000 could open the door to $3,800. The RSI is not oversold, so there is room for another leg down.
Medium‑term (September–December 2026): If the Fed signals a pause or rate cuts, gold could rally toward $4,800–$5,000. Central bank buying and geopolitical uncertainty should provide a floor. The 200‑day MA at $4,484 is the first major hurdle. A weekly close above that level would be the signal bulls have been waiting for.
Long‑term (2027+): Armstrong’s computer model indicates the correction could reach 30%, which would put gold near $3,915. That would be the ultimate bottom. From there, gold could resume its bull market toward $5,500+ as the macro environment becomes more favorable.
My Take on Gold Price
Armstrong is right about one thing: markets move in cycles, not straight lines. A 28% correction from $5,600 to $4,000 is painful, but it is not the end of the bull market.
The $4,000 level is holding for now. The bounce is real. But the 200‑day MA at $4,484 is far above price, and the RSI is not oversold. That means the correction may not be over yet.
For long‑term investors, the $4,000‑$4,100 zone offers a reasonable entry. For short‑term traders, waiting for a weekly close above $4,300 or the 200‑day MA is safer.
Subscribe to our YouTube channel for daily crypto updates, market insights, and expert analysis.
The post Gold Price Just Flashed a Signal Bulls Have Been Waiting Months For! appeared first on CaptainAltcoin.


You May Also Like
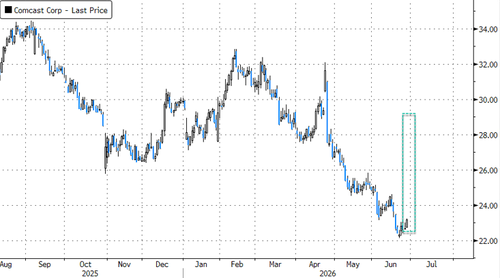
Comcast Shares Jump Most Since 2008 On Plans To Separate Units

Will XRP Price Increase In September 2025?


