

Procter & Gamble Stock Keeps Sliding. The Dividend Keeps Climbing.
Key Takeaways for Procter & Gamble Stock as of July 2026
- CFO Andre Schulten confirmed a 3% dividend increase on the Q3 fiscal 2026 call, marking P&G’s 70th consecutive annual raise, while the company plans to return roughly $15 billion to shareholders this fiscal year.
- The quarterly payout stands at $1.06, up from $1.01 four quarters earlier.
- A 64% payout ratio and 2.9% yield on Procter & Gamble stock: comfortable footing for a streak that old.
- TIKR’s mid-case model prices Procter & Gamble stock at $202 by June 2030, a 33% total return at 8% annualized.
P&G committed to raising its dividend through a $1 billion after-tax cost headwind. See what that means for the payout ratio. Analyze PG’s dividend on TIKR for free →
P&G Kept Raising Its Dividend While Warning of $1 Billion in New Costs
Procter & Gamble (PG) announced its 70th consecutive annual dividend increase on the Q3 fiscal 2026 earnings call in April, raising the quarterly payment to $1.06 and extending a payout record that stretches back 136 unbroken years.
That declaration landed in the same quarter the company flagged roughly $1 billion in after-tax cost headwinds from the Middle East conflict, a figure CFO Andre Schulten told analysts “is nothing to sneeze at.”
Schulten traced the pressure beyond crude oil to petrochemical feedstock inflation, costlier sourcing lanes, reformulation charges when materials become unavailable, and diesel-driven logistics increases hitting the P&L in the fiscal fourth quarter.
P&G returned $3.2 billion to shareholders in the quarter alone, splitting $2.5 billion in dividends from over $600 million in share repurchases. For the full fiscal year, management guided to approximately $10 billion in dividends and $5 billion in buybacks.
Organic sales grew more than 3% in the quarter, and core earnings per share came in at $1.59, up 3% year over year. Schulten told analysts the company would land toward the lower end of its $6.83 to $7.09 core EPS guidance range for fiscal 2026.
“We will not compromise on the investment in the parts of the business that are showing momentum,” he said.
Adjusted free cash flow productivity ran at 82% for the quarter, with full-year guidance of 85% to 90%. Schulten framed productivity improvements of 330 basis points as the first offset to cost headwinds, with selective innovation-led pricing covering part of the gap.
P&G guided to $10 billion in dividends and $5 billion in buybacks for fiscal 2026. See how that stacks up against cash flow. Review PG’s financials on TIKR for free →
PG’s 70-Year Dividend Streak Sits on a Payout Ratio That Hasn’t Cracked
 PG Stock Dividends (TIKR)
Procter & Gamble raised its quarterly dividend from $1.01 to $1.06, a step up that extends the longest active annual increase streak in consumer staples. Four consecutive quarters at $1.01 preceded four consecutive quarters at $1.06, a clean step-function visible in the trajectory data.
 PG Stock Payout Ratio (TIKR)
The payout ratio as of the March 2026 quarter sits at 64%. That figure has swung from a low of 53% in December 2024 to a high of 78% in June 2024, but the most recent reading falls squarely in the middle of that range. It backs Schulten’s claim that the dividend has room even with earnings migrating toward the lower end of guidance.
 PG Stock Dividend Yield (TIKR)
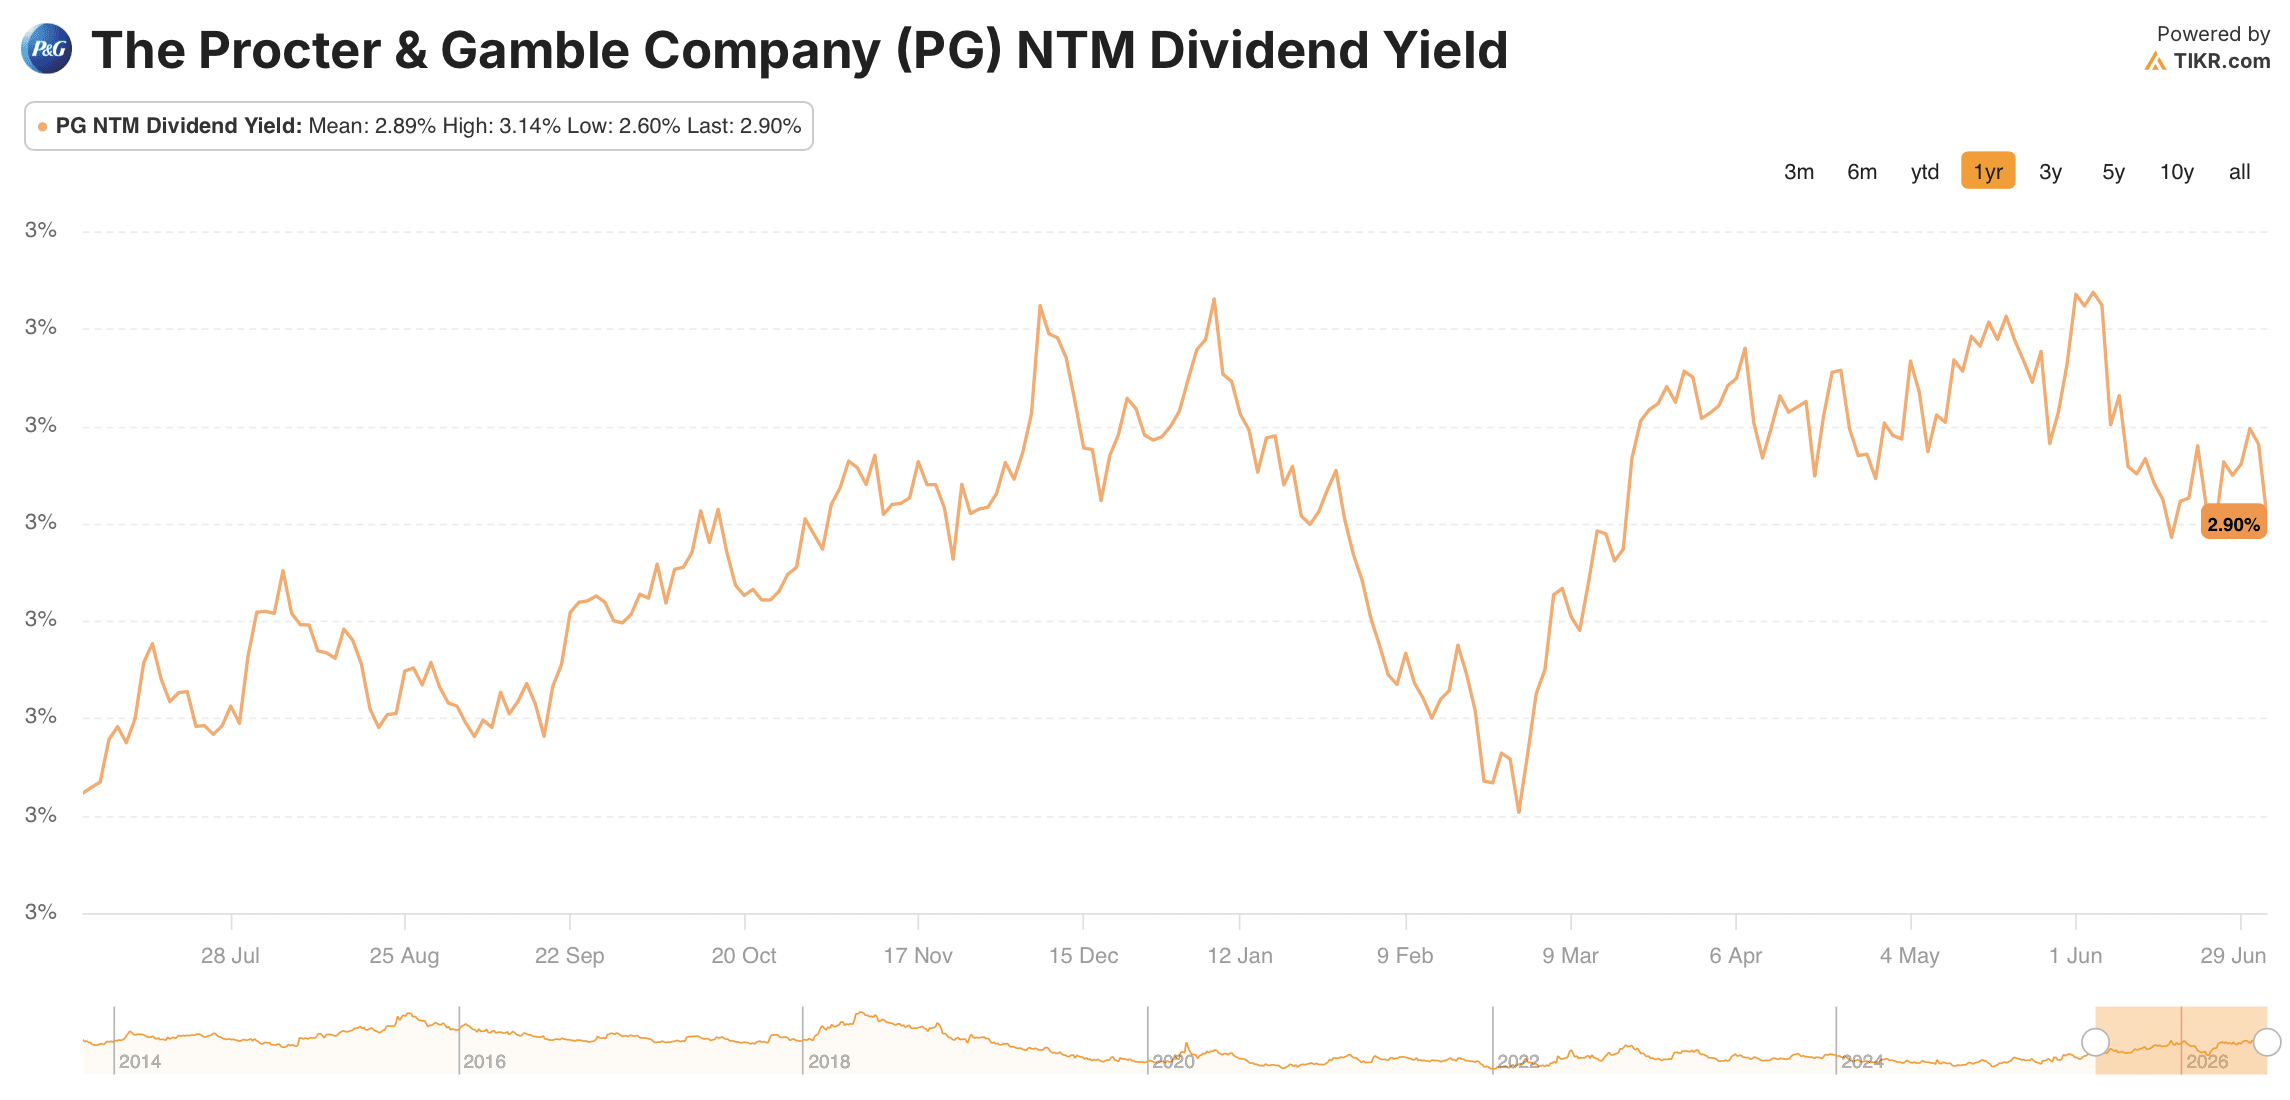
Procter & Gamble stock’s yield has drifted from 2.5% a year ago to 2.9% today. The widening reflects the stock’s price decline more than any acceleration in the payout itself.
Yield at 2.9% against a 64% payout ratio gives income investors a rare pairing for a name with 70 consecutive annual raises. Whether that ratio holds below 70% through the cost-heavy fiscal fourth quarter will determine if the streak’s margin of safety stays intact.
TIKR’s $202 Target Prices Procter & Gamble Stock for a Slow Grind Higher
TIKR’s mid-case model sets a $202 target for Procter & Gamble stock by June 2030, a 33% total return from the current $151 price, annualizing at 8%.
 PG Stock Valuation Model Results (TIKR)
For a consumer staples name trading at $151, that return profile prices in steady compounding rather than a sharp re-rating.
Schulten’s call laid out the case: organic sales growth running above 3%, productivity improvements of 330 basis points funding reinvestment, and a capital return program sized at roughly $15 billion for the fiscal year.
The cost headwinds are real, but P&G’s willingness to absorb them rather than slash spending suggests the earnings trajectory management outlined can support the model’s path to $202.
TIKR’s model implies 33% upside from $151 over four years. Stress-test those assumptions yourself. Build a PG valuation model on TIKR for free →
Should You Invest in The Procter & Gamble Company?
The only way to really know is to look at the numbers yourself. TIKR gives you free access to the same institutional-quality financial data that professional analysts use to answer exactly that question.
Pull up The Procter & Gamble Company stock and you’ll see years of historical financials, what Wall Street analysts expect for revenue and earnings in the quarters ahead, how valuation multiples have moved over time, and whether price targets are trending up or down.
You can build a free watchlist to track The Procter & Gamble Company alongside every other stock on your radar. No credit card required. Just the data you need to decide for yourself.
Access Professional Tools to Analyze PG stock on TIKR for Free →


You May Also Like
Dow Jones Industrial Average Flirts With Historic Milestone Before Pulling Back

Was Michael Burry Right About Palantir? PLTR Is Still Down Over the Past Year
MAGA melts down as Bruce Springsteen torches Trump in new interview: 'He is a coward'



