Solana has struggled to recover after a recent price decline, with SOL remaining capped below the $130 resistance. The altcoin has shown attempts to stabilize, Solana has struggled to recover after a recent price decline, with SOL remaining capped below the $130 resistance. The altcoin has shown attempts to stabilize,

Solana Price Depends On Existing SOL Holders, Here’s Why

Solana has struggled to recover after a recent price decline, with SOL remaining capped below the $130 resistance. The altcoin has shown attempts to stabilize, yet momentum remains fragile. 

Unlike previous rallies driven by new inflows, the next move appears dependent on existing Solana holders rather than fresh market entrants.

Some Solana Holders Show Resilience

On-chain data shows early signs of stabilization. The Chaikin Money Flow has posted a sharp uptick over the past few days. Although the indicator remains below the zero line, the upward movement suggests that capital outflows are slowing.

This shift is critical for Solana’s recovery outlook. Declining outflows often precede a transition toward inflows. Once buying pressure outweighs selling, SOL price can respond quickly. Sustained improvement in CMF would signal returning confidence among current holders.

Want more token insights like this? Sign up for Editor Harsh Notariya’s Daily Crypto Newsletter here.

Solana CMF
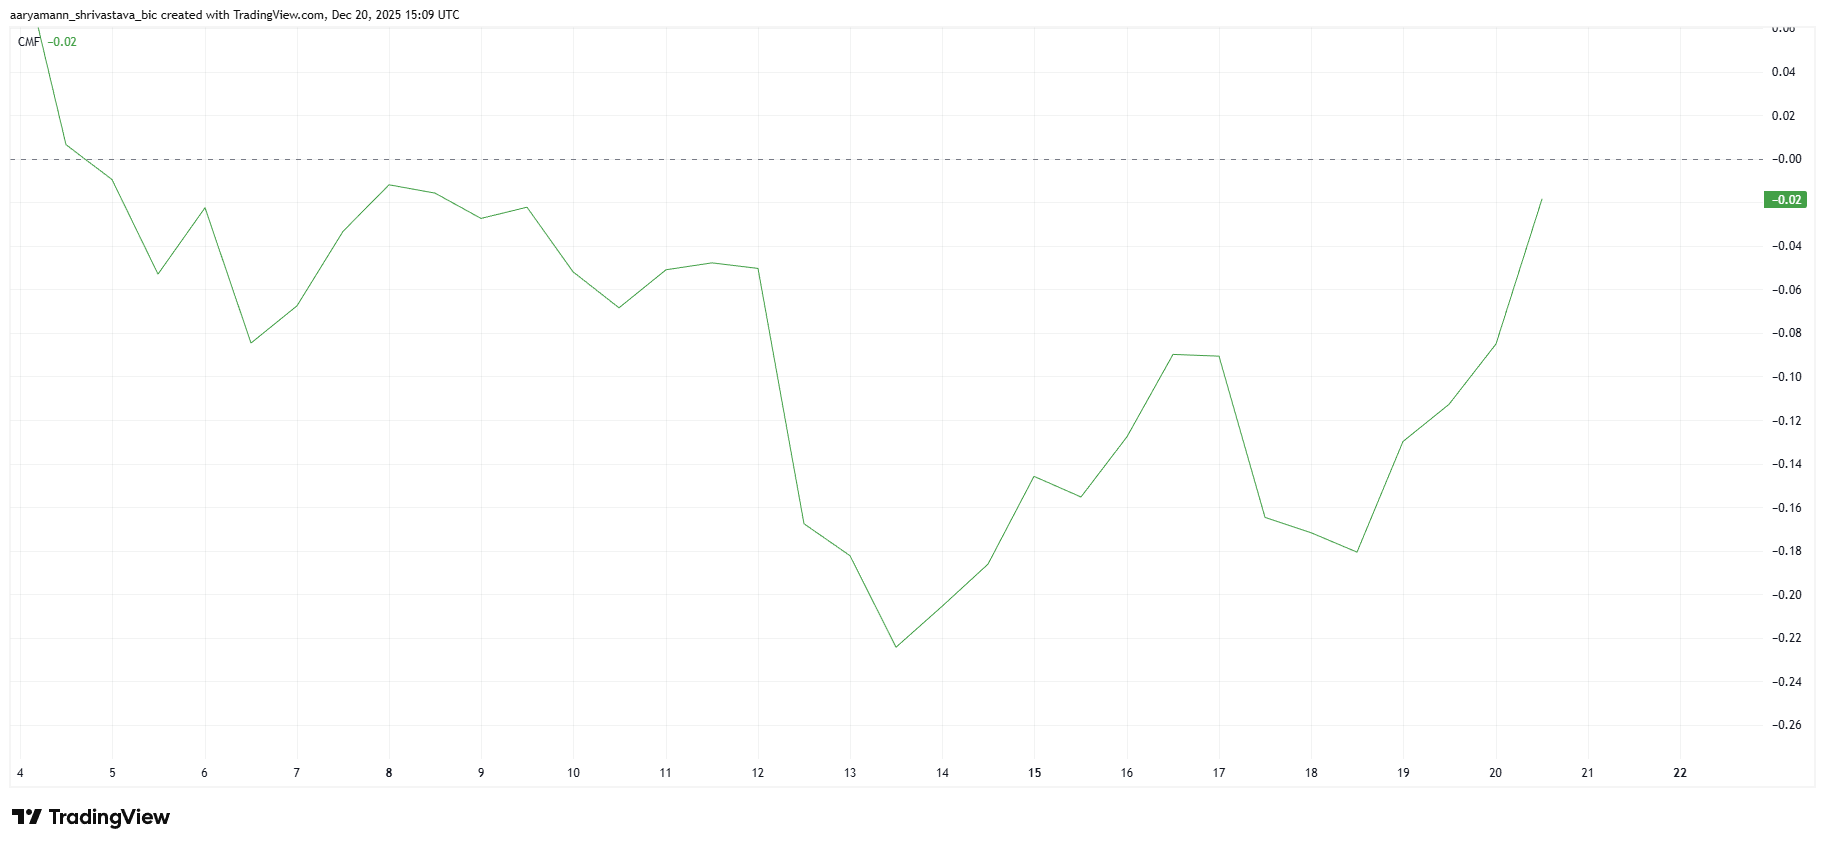
Solana CMF. Source: TradingView

Macro indicators present a more cautious picture. The number of new Solana addresses has dropped sharply in recent sessions. New addresses declined from 6.077 million to 5.390 million, an 11.3% decrease over ten days.

Falling network participation suggests weaker speculative interest. New investors appear hesitant, citing limited short-term incentives. This lack of fresh demand places greater importance on existing holders to support price stability and any recovery attempt.

Solana New Addresses
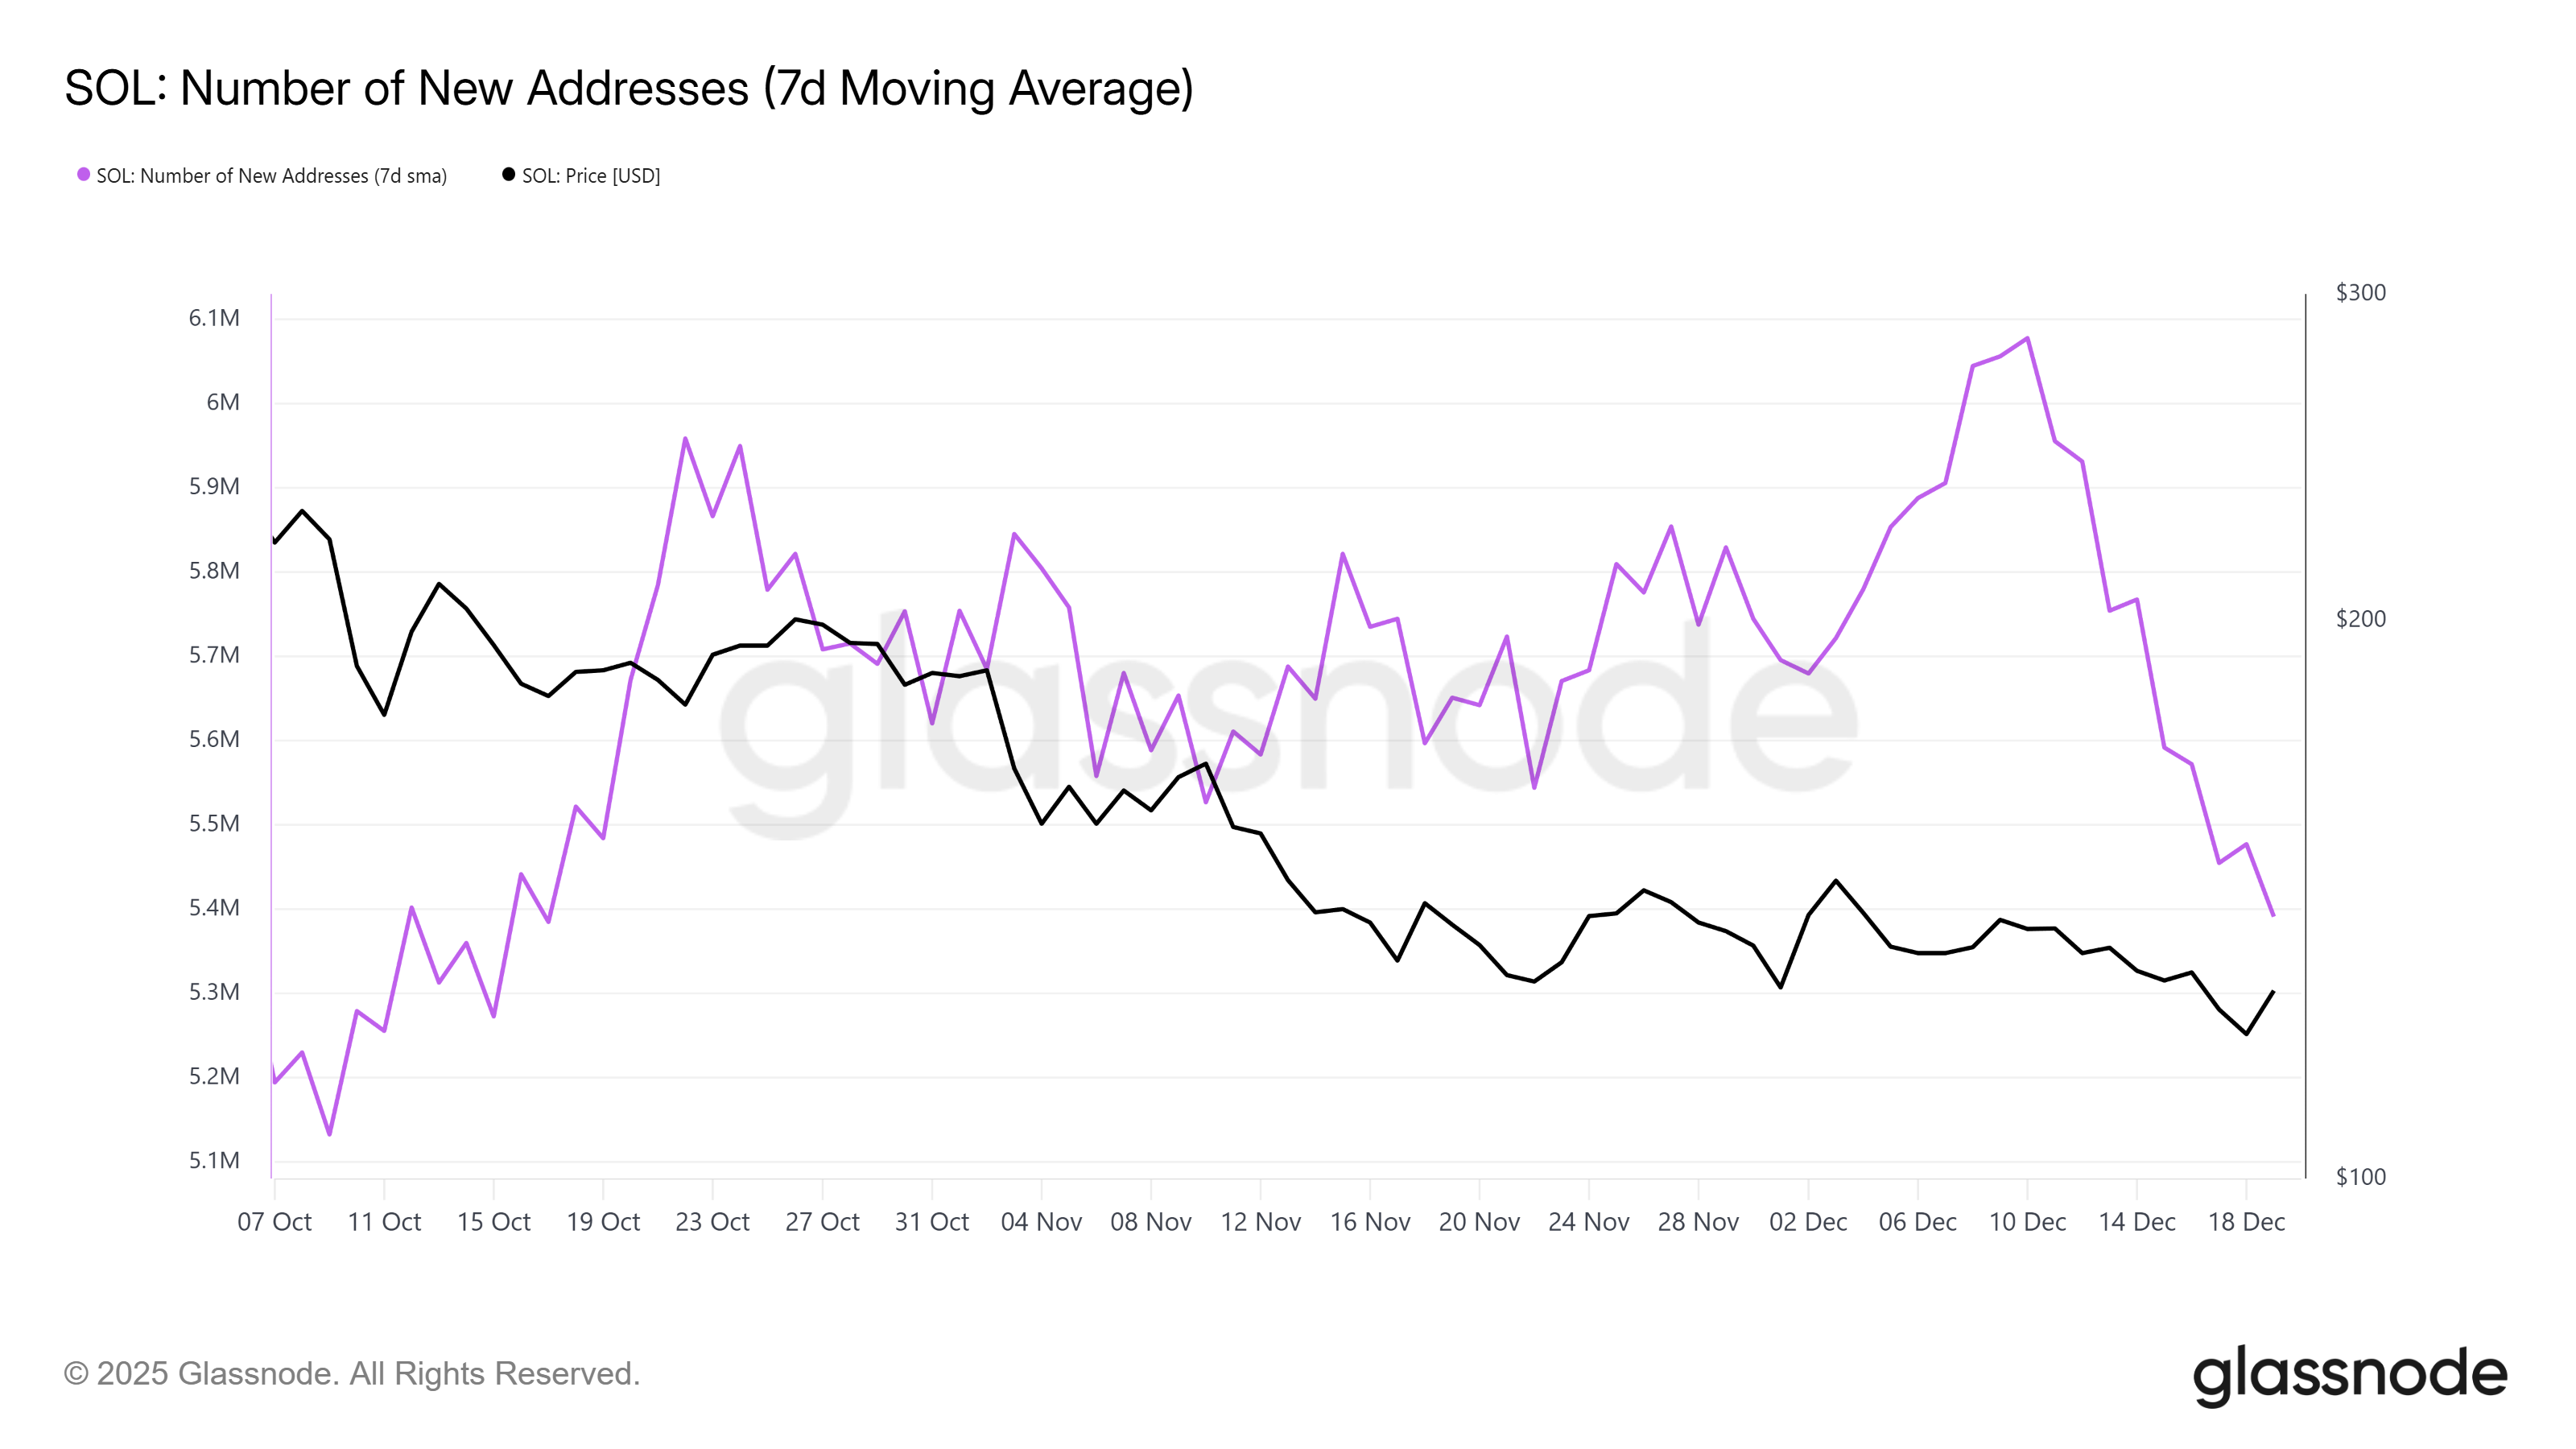
Solana New Addresses. Source: Glassnode

SOL Price Recovery Is Possible

Solana trades near $126 at the time of writing, remaining below the $130 resistance level. Price action shows consolidation rather than a breakout. The immediate goal for SOL is reclaiming $130, which would mark a shift in short-term momentum.

Declining outflows improve the probability of a rebound. If current holders maintain accumulation and inflows emerge, buying pressure could lift SOL toward $130. A sustained move above this level would require consistent support rather than brief speculative spikes.

Solana Price Analysis. 
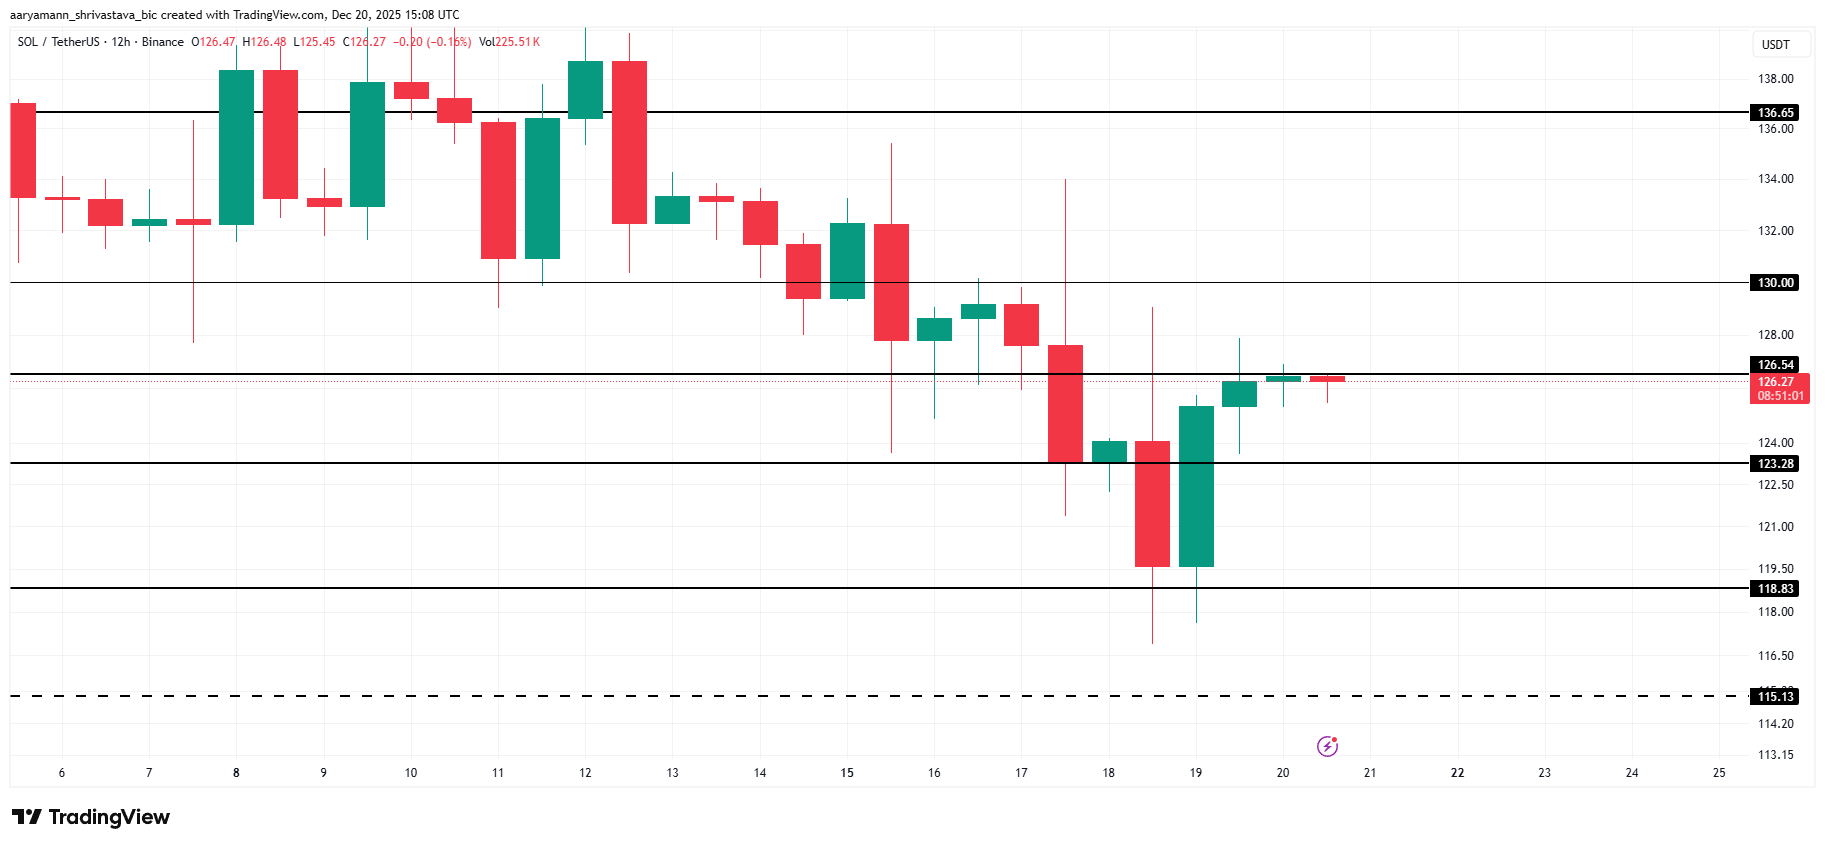
Solana Price Analysis. Source: TradingView

Downside risks persist if sentiment deteriorates. Renewed selling could push Solana below the $123 support. A breakdown at that level may expose $118 as the next downside target. Losing this support would invalidate the bullish outlook and reinforce short-term weakness.

Market Opportunity
Solana Logo
Solana Price(SOL)
$125.14
$125.14$125.14
-1.14%
USD
Solana (SOL) Live Price Chart
Disclaimer: The articles reposted on this site are sourced from public platforms and are provided for informational purposes only. They do not necessarily reflect the views of MEXC. All rights remain with the original authors. If you believe any content infringes on third-party rights, please contact service@support.mexc.com for removal. MEXC makes no guarantees regarding the accuracy, completeness, or timeliness of the content and is not responsible for any actions taken based on the information provided. The content does not constitute financial, legal, or other professional advice, nor should it be considered a recommendation or endorsement by MEXC.

You May Also Like

WTO report: Artificial intelligence could drive nearly 40% of global trade growth by 2040

WTO report: Artificial intelligence could drive nearly 40% of global trade growth by 2040

PANews reported on December 21 that, according to Jinshi, the World Trade Organization's "World Trade Report 2025" indicates that, with supporting policies in place
Share
PANews2025/12/21 11:40
Bitcoin 8% Gains Already Make September 2025 Its Second Best

Bitcoin 8% Gains Already Make September 2025 Its Second Best

The post Bitcoin 8% Gains Already Make September 2025 Its Second Best appeared on BitcoinEthereumNews.com. Key points: Bitcoin is bucking seasonality trends by adding 8%, making this September its best since 2012. September 2025 would need to see 20% upside to become Bitcoin’s strongest ever. BTC price volatility is at levels rarely seen before in an unusual bull cycle. Bitcoin (BTC) has gained more this September than any year since 2012, a new bull market record. Historical price data from CoinGlass and BiTBO confirms that at 8%, Bitcoin’s September 2025 upside is its second-best ever. Bitcoin avoiding “Rektember” with 8% gains September is traditionally Bitcoin’s weakest month, with average losses of around 8%. BTC/USD monthly returns (screenshot). Source: CoinGlass This year, the stakes are high for BTC price seasonality, as historical patterns demand the next bull market peak and other risk assets set repeated new all-time highs. While both gold and the S&P 500 are in price discovery, BTC/USD has coiled throughout September after setting new highs of its own the month prior. Even at “just” 8%, however, this September’s performance is currently enough to make it Bitcoin’s strongest in 13 years. The only time that the ninth month of the year was more profitable for Bitcoin bulls was in 2012, when BTC/USD gained about 19.8%. Last year, upside topped out at 7.3%. BTC/USD monthly returns. Source: BiTBO BTC price volatility vanishes The figures underscore a highly unusual bull market peak year for Bitcoin. Related: BTC ‘pricing in’ what’s coming: 5 things to know in Bitcoin this week Unlike previous bull markets, BTC price volatility has died off in 2025, against the expectations of longtime market participants based on prior performance. CoinGlass data shows volatility dropping to levels not seen in over a decade, with a particularly sharp drop from April onward. Bitcoin historical volatility (screenshot). Source: CoinGlass Onchain analytics firm Glassnode, meanwhile, highlights the…
Share
BitcoinEthereumNews2025/09/18 11:09
Boom Then Bust? BTC Eyes $175K Before Catastrophic 80% Drop

Boom Then Bust? BTC Eyes $175K Before Catastrophic 80% Drop

Bitcoin may hit $175K before a 70–80% drop, with $4.9T options expiring and patterns suggesting short-term volatility.
Share
CryptoPotato2025/09/19 17:51