

Bitcoin Price Nearing Top? $60K Liquidity Sweep Looming
Key Insights
- Bitcoin price faced pressure as downside liquidity stacked below.
- Analysts mapped clusters between $70K, $66K, and $60K.
- Short squeezes persisted, but reversal risks continued building.
Bitcoin price approached upper range levels this week as traders flagged growing downside liquidity.
Market participants tracked clusters forming below current levels, raising reversal expectations. The move came as repeated short squeezes lifted the price despite bearish positioning.
Crypto market data showed that traders continued betting against the trend while the price climbed.
That divergence created conditions where forced liquidations pushed the price higher in the short term. Still, analysts warned that liquidity below remained the dominant magnet for the next move.
Bitcoin Price Rally Driven By Short Liquidations
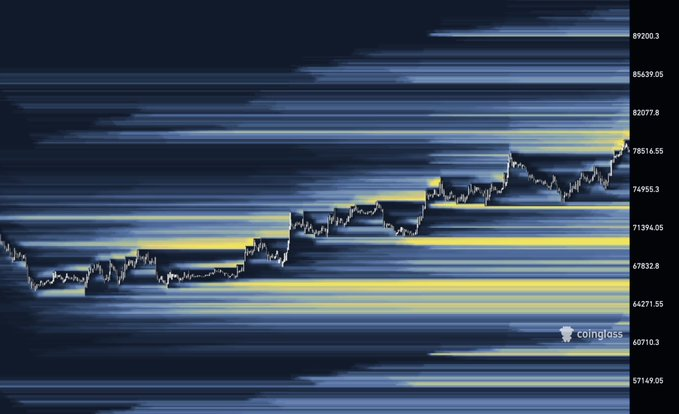
Data shared by CrypNuevo showed that traders targeted short positions near the upper range between recent highs.
The setup suggested weakening momentum as the price tested that zone, increasing the likelihood of a local top forming. That reaction followed a pattern where rallies stalled once liquidity above was cleared.
 BTC/USD liquidation chart | Source: X
Max Trades noted that most upside liquidity had already been swept during the recent push. That shift occurred because traders who placed stop orders above resistance levels got liquidated.
As a result, the market structure changed, leaving fewer targets above and increasing focus on lower liquidity zones.
This dynamic kept the price elevated temporarily, as new short positions entered the market and got squeezed.
Each squeeze extended the rally slightly, but the underlying liquidity imbalance remained intact. Traders expected that once the flow of short liquidations slowed, the price would rotate downward.
Bitcoin Price Faces Heavy Downside Liquidity Zones
Max Trades identified three key downside clusters forming below the current range. The first cluster sat near a key support zone, while a deeper concentration appeared near the lower boundary of the range.
The final cluster extended across a broader zone further below, indicating layered demand for liquidity sweeps.
This structure suggested that the market had unfinished business on the downside. Liquidity clusters often act as targets because they contain stop orders and leveraged positions. When price moves toward those areas, it triggers a chain reaction of liquidations that accelerates momentum.
CrypNuevo reinforced that outlook by preparing short positions near range highs. The analyst expected price to remain within the range before eventually rotating lower. That expectation aligned with the broader liquidity map, which showed stronger incentives below than above.
Funding Rates Signal Market Disbelief Phase
Darkfost’s analysis on Binance data showed that funding rates remained negative despite rising price action.
The indicator tracked cumulative funding over a thirty-day period, offering a broader view of market sentiment. Traders continued betting against the rally, creating a disconnect between positioning and price direction.
 BTC/USD funding rates. Source: X
Historical comparisons showed a similar pattern during the early recovery phase after the previous bear cycle. At that time, persistent negative funding coincided with gradual price increases. That setup reflected a disbelief phase, where traders resisted the trend and got squeezed repeatedly.
The current environment mirrored that structure, though with less extreme readings. The persistence of negative funding suggested that the rally had not yet reached full market conviction.
Instead, it relied on forced liquidations rather than organic demand, making it vulnerable once pressure eased.
 Source: X
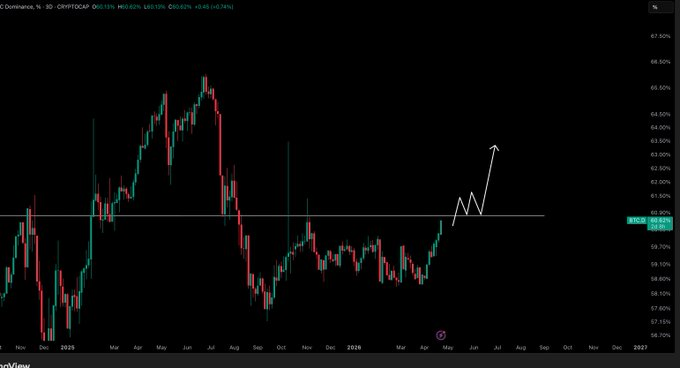
Crypto Tony’s update on market dominance added another layer to the outlook. The analyst noted that if dominance flipped a key level into support, altcoins would likely face pullbacks. That shift would reinforce Bitcoin’s relative strength while limiting broader market expansion.
Bitcoin price remained within its established range as traders monitored liquidity shifts. The next move depended on whether short squeezes continued driving price higher or faded. If momentum weakened, price would likely target the deeper liquidity clusters identified below.
The post Bitcoin Price Nearing Top? $60K Liquidity Sweep Looming appeared first on The Market Periodical.


You May Also Like

What to Buy in Japan: The Singapore Traveller’s Guide (2026)
Trump hemorrhaging support from crucial voting bloc as campaign promises meet reality


