

Can Pinterest Stock Break $23.80 After 17.8% Revenue Growth?

Pinterest stock is in a genuine recovery phase, trading at $21.77 after reclaiming short-term moving averages. The daily structure is improving — but the 200-day EMA at $23.80 sits roughly 9% overhead. PINS is recovering, not recovered. Bulls still face a meaningful ceiling before claiming control.
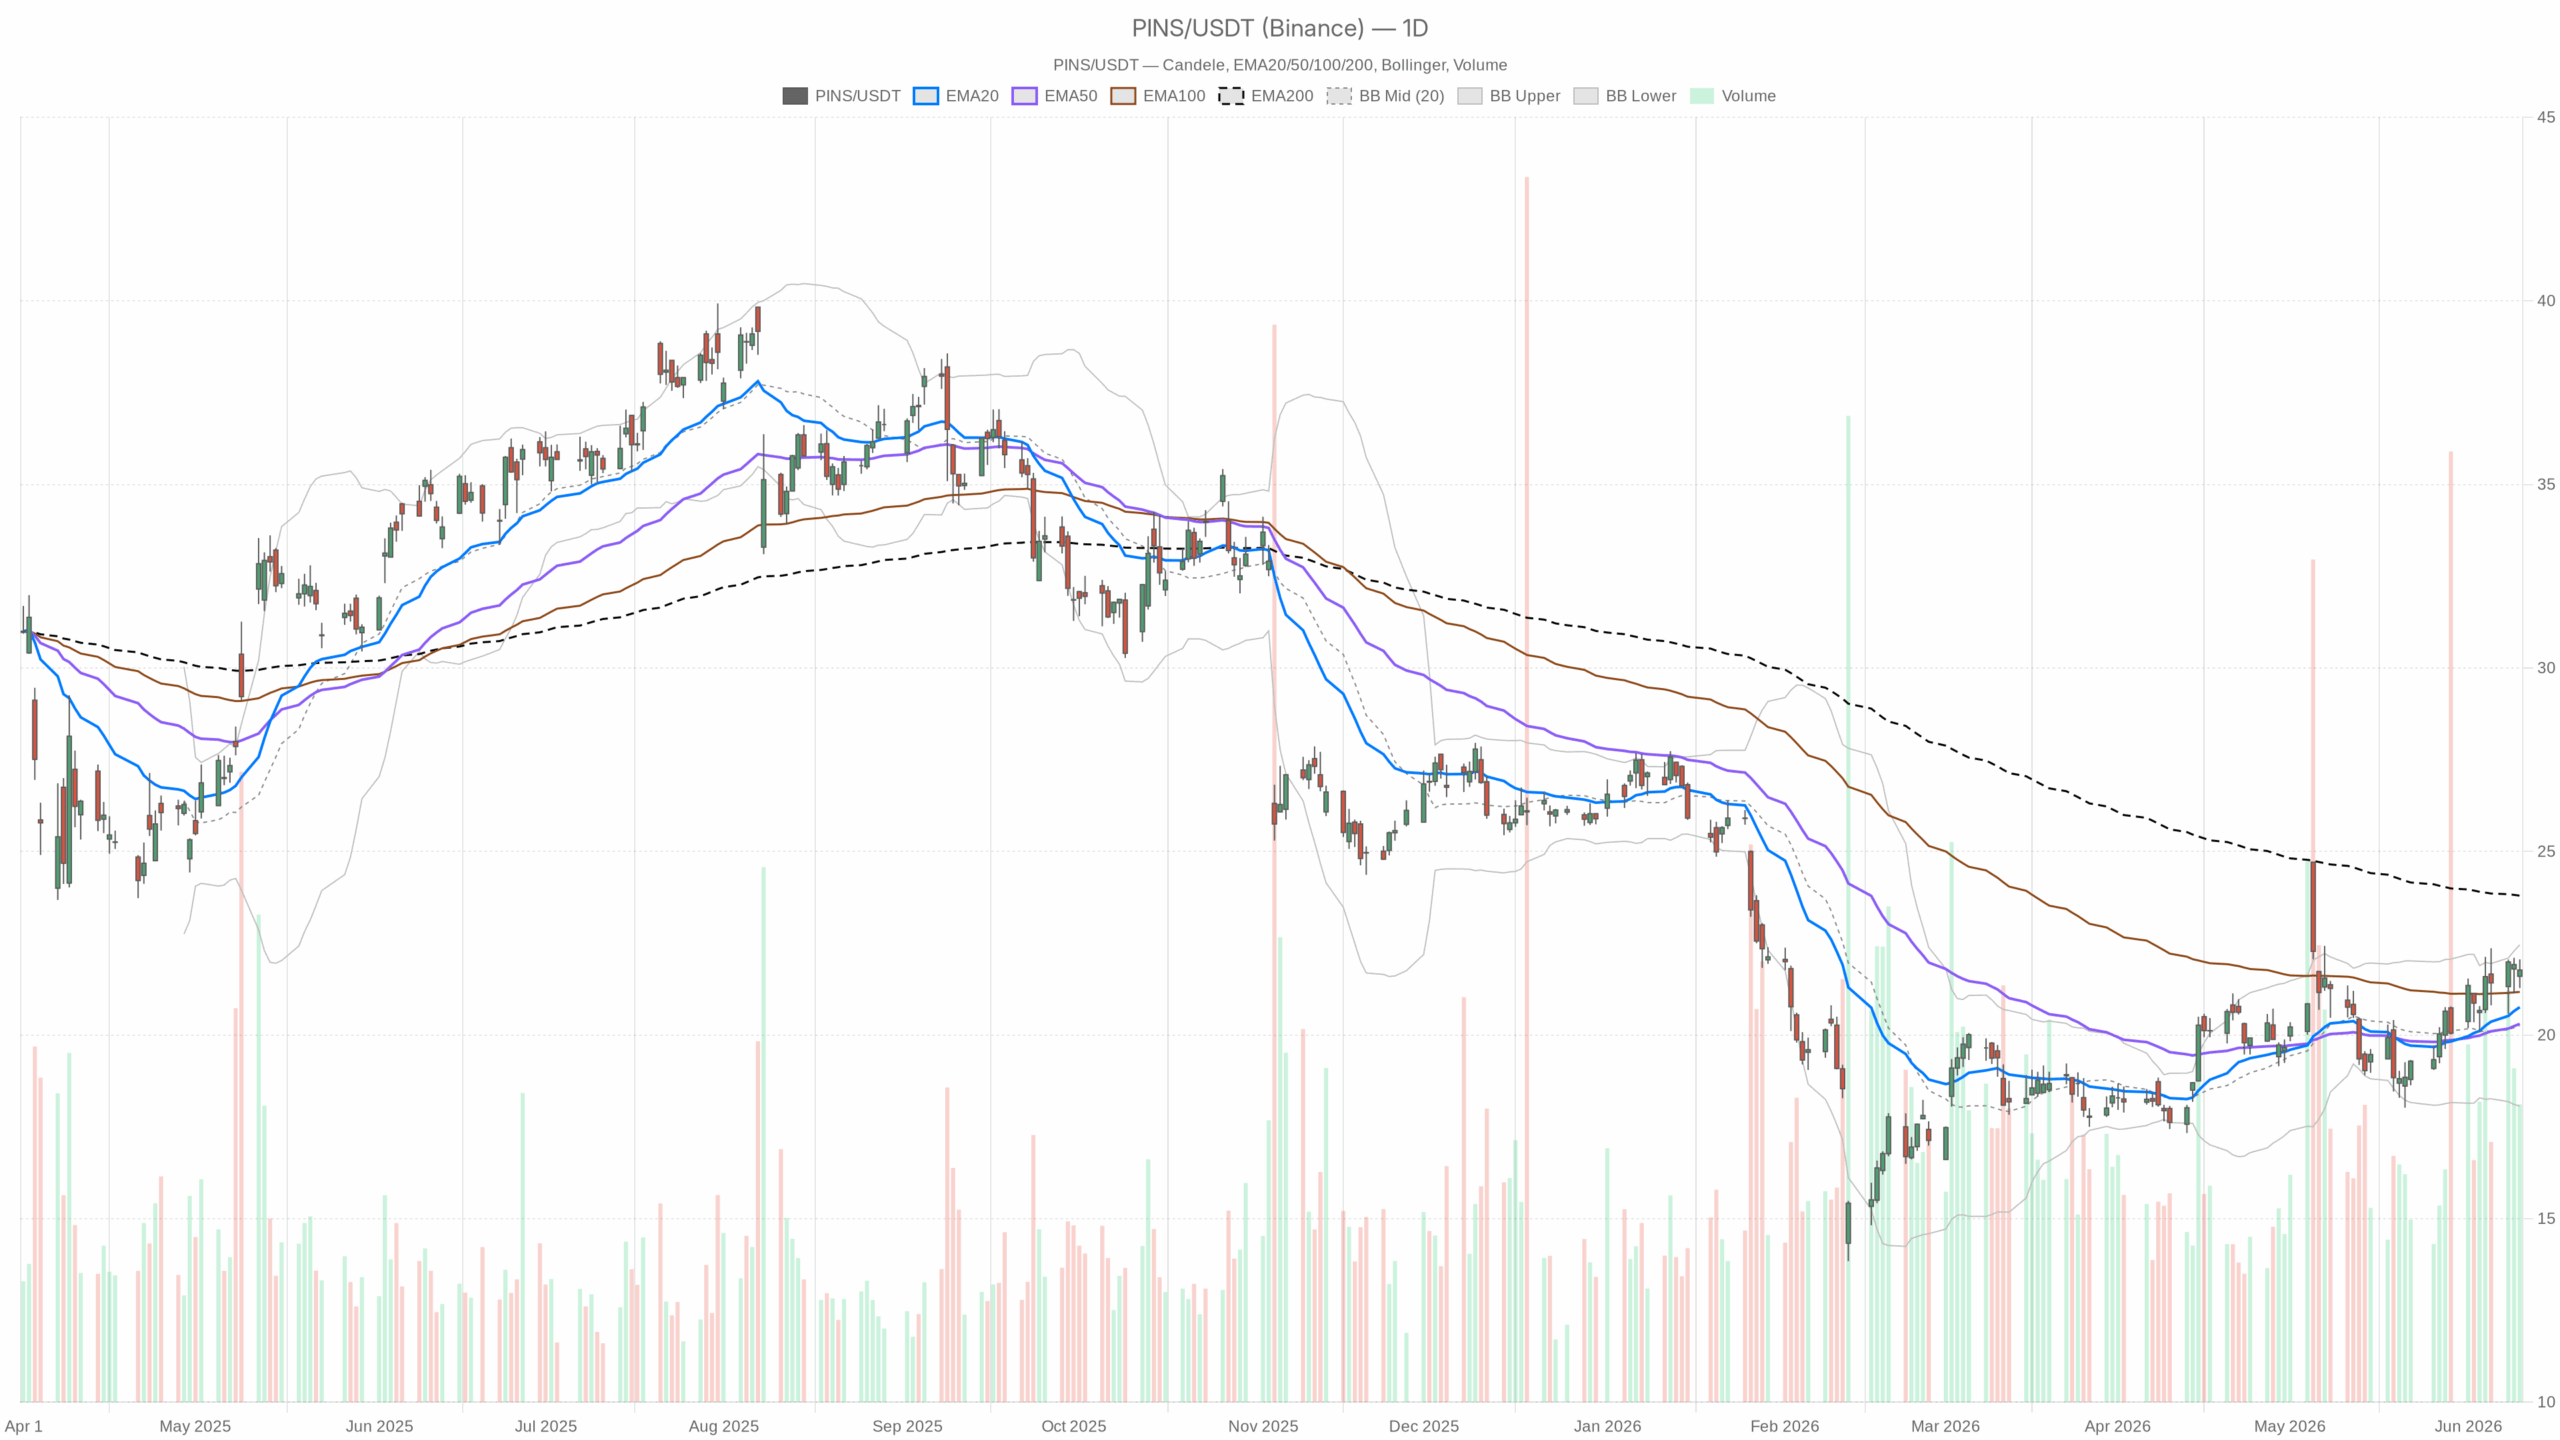 PINS — daily chart with candlesticks, EMA20/EMA50 and volume.
Daily Chart: Recovery Gains Traction, 200-Day Resistance Stands Firm
The daily timeframe sets a cautiously optimistic tone. Price is trading above both the 20-day EMA at $20.76 and the 50-day EMA at $20.30. This configuration indicates short-term and medium-term momentum are aligned to the upside. However, the 200-day EMA at $23.80 remains a significant overhead obstacle — roughly 9% above current price. That gap is too wide to ignore. PINS is recovering, not recovered.
Momentum Indicators Signal Strength Without Exhaustion
Daily RSI sits at 60.18, comfortably in bullish territory without being overbought. There is still room for further upside before momentum becomes stretched. The MACD reinforces this view: the line at 0.52 is above the signal line at 0.33, with a positive histogram of 0.19. That positive spread signals active buying pressure on the daily chart. Momentum is building, not fading.
Bollinger Bands and Pivot Structure
On the Bollinger Band structure, price at $21.77 sits just below the upper band at $22.46, while the midline rests at $20.26. This placement suggests PINS is in the upper half of its recent range — a zone that typically reflects trend strength rather than mean-reversion pressure. At the same time, the proximity to the upper band warrants attention. A clean break and close above $22.46 would be notably bullish. A rejection there would be the first warning sign.
Daily ATR of 1.08 points to moderate volatility. Sessions can swing roughly a dollar in either direction — meaningful context for anyone managing risk around current levels. The daily pivot structure places support at $21.35 (S1) and resistance at $22.13 (R1). The pivot point itself sits at $21.70, almost exactly where price closed. PINS is sitting on the fence at the daily pivot.
The daily regime is classified as neutral, a fair summary of the situation. The trend structure is improving and momentum indicators are tilted bullish. However, price is not yet in breakout territory. The stock is still working through overhead supply.
Intraday Picture: 1H Trend Supports the Recovery
Meanwhile, the 1H timeframe adds a layer of near-term confidence. The hourly regime is explicitly bullish, with price at $21.78 sitting above the 20-period EMA at $21.67 and the 50-period EMA at $21.35. The 200-period hourly EMA at $20.44 is well below — a sign the intraday trend structure is clean and unambiguous. Hourly RSI at 54.03 is neutral-to-positive, which is not alarming. It suggests the 1H trend is healthy rather than overextended.
1H MACD Caution and 15-Minute Consolidation
However, the 1H MACD histogram is marginally negative at -0.03, with the line at 0.11 and the signal at 0.15. This is a subtle but real caution signal. Short-term momentum on the hourly chart is slightly losing pace. It does not break the bullish case. But it does suggest the immediate, intraday push may be slowing. The overall 1H picture confirms the daily recovery thesis without adding fresh acceleration.
On the 15-minute chart, the setup is essentially flat. The MACD line and signal are both at -0.02, with a histogram of zero. RSI sits at 52.21 — perfectly neutral. Price is hugging its short-term EMAs tightly. In execution terms, this means the stock is consolidating near recent highs, neither breaking out nor breaking down. For traders, this is a waiting zone rather than an entry signal in either direction.
Fundamental Tailwinds Reinforce the Technical Setup
The fundamental backdrop reinforces the technical picture. Q1 2026 revenue grew 17.8% year-over-year. Monthly active users are rising and average revenue per user is improving. Oppenheimer raised its price target from $24 to $30 in early May, maintaining an Outperform rating. Multiple analysts have recently framed PINS as a value opportunity, pointing to low EBITDA multiples relative to growth. The pessimism around market share loss appears to be receding. Meanwhile, the conversation is shifting toward monetization acceleration.
Two Scenarios for Pinterest Stock
Bullish Path: Above $22.46 Toward the 200-Day
The bullish scenario is straightforward. If PINS clears the daily R1 at $22.13, the next target is the Bollinger upper band near $22.46. A break above that level opens the path toward the 200-day EMA at $23.80. Continued strong user metrics, positive analyst commentary, and improving macroeconomic sentiment would support that trajectory. The 1H trend structure is already aligned to facilitate such a move, provided the MACD recovers its momentum on that timeframe.
Bearish Path: Rejection Risks Retesting the 20-Day EMA
In contrast, the bearish scenario centers on resistance. A rejection at the upper Bollinger Band or the $22.13 R1 level could trigger a pullback. The first supports are the daily pivot at $21.70 and S1 at $21.35. Below that, the 20-day EMA at $20.76 becomes the critical line. A daily close beneath the 20-day EMA would meaningfully weaken the recovery thesis. It would suggest the rally is stalling rather than transitioning into a sustained uptrend. The neutral daily regime label is a reminder that this scenario is not unlikely.
Pinterest Stock Outlook: Constructive, Not Yet Confirmed
Pinterest stock presents a constructive but unconfirmed setup. The daily trend is improving, momentum is positive, and the fundamental story is developing in the right direction. Nevertheless, the 200-day EMA overhang is real. The stock has not yet proven it can sustain trading above $22. Positioning here requires respecting both the emerging bullish structure and the structural resistance overhead. Volatility is moderate. Still, the next few sessions around the $22 to $22.50 zone will prove decisive. Either this recovery has real legs — or it needs more time to consolidate.


You May Also Like

Citigroup Plans Tokenized Private Company Shares as SpaceX and Anthropic IPO Demand Builds

Fed Governor Calls For Strong Stablecoin Oversight As CLARITY Act’s Final Text Gets Delayed

Wall Street indexes jump as Trump says strikes against Iran cancelled


