

Can Hyperliquid (HYPE) Turn Momentum Into a $70 Breakout? Bulls Face a Big Test
- Hyperliquid is currently trading at $66.
- HYPE’s trading volume has risen by 80%.
The two clear rejections near the same resistance zone indicate that sellers have repeatedly stepped in to prevent a breakout. At the same time, price has continued to hold above a higher support area, suggesting buyers are still defending the trend.
This creates a classic decision point, a move above resistance could trigger another bullish leg higher, while a break below support would invite increased selling pressure and a deeper correction. The current structure reflects a wait for confirmation before a major move.
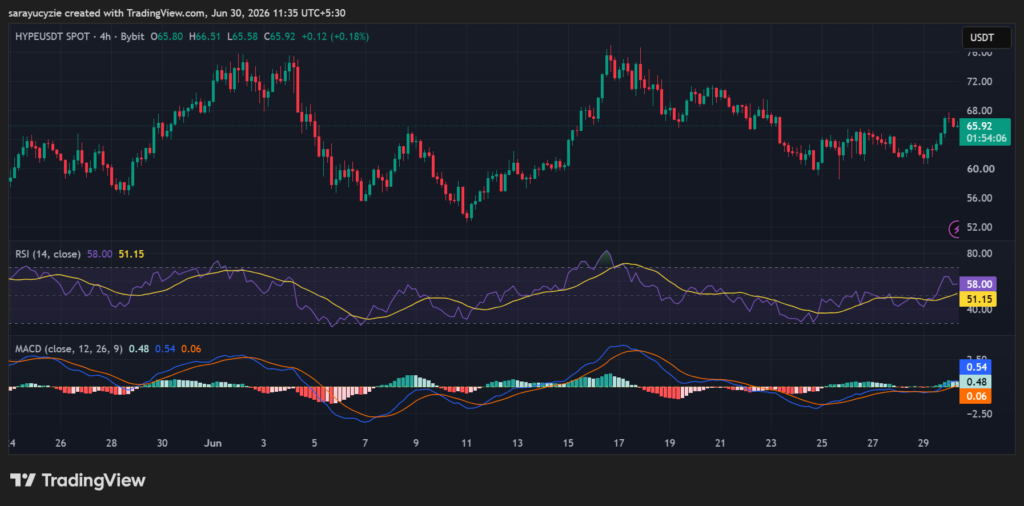
Current price action of Hyperliquid (HYPE) is trading at $66.19, up by over 6% in the past 24 hours. It indicates that the buyers have regained some short-term momentum while the token remains below its key resistance level.
Hyperliquid’s opening price was noted at $61.58, and after the bulls took control, the price was pushed to a high of $67.63. Besides, the daily trading volume has increased by over 80.59%, reaching $645.19 million.
With the active uptrend in the HYPE market, the price could move up to the resistance at $67.84. A potential bullish correction initiates the golden cross to take place, and gradually pushes the asset’s price even higher. If the Hyperliquid momentum takes a bearish turn, the price action could see a slip to the support at $65.31. Assuming the downside pressure gains more traction, the death cross might emerge, triggering the price to fall.
Will the Hyperliquid Gain More Momentum?
The 4-hour technical analysis reports that the Moving Average Convergence Divergence (MACD) line is above the signal line and both are above the zero line. This indicates that bullish momentum is strengthening. The bullish crossover of HYPE suggests buyers are gaining control. This setup often supports further upside, provided buying momentum continues to hold.
 (Source: TradingView)
In addition, the daily Relative Strength Index (RSI) of Hyperliquid, positioned at 58, indicates moderately bullish sentiment. Technically, the value is above the neutral level, 50, showing that buyers have the upper hand. At the same time, it remains below the overbought zone, and there is still room for the uptrend to continue. This reading reflects healthy buying interest.
These indicators can positively influence the price action. The upward price movement is more likely than the downward movement. However, price still depends on key support and resistance levels, trading volume, and overall market sentiment.
Crypto Market Highlights
Bitcoin (BTC) Caught in a Tight Range: Will $58K Support or $61K Resistance Give Way First?


You May Also Like

StakeStone (STO) Rockets 125%: What $981M Trading Volume Reveals

Solana price confirms bearish crossover following Drift exploit, will it crash?


