POL (prev. MATIC) Price Prediction 2026, 2027-2030
- Bullish POL price prediction for 2026 is $ 0.1867 to $0.2538.
- POL (prev. MATIC) price might reach $1 soon.
- Bearish POL price prediction for 2026 is $0.1006.
In this POL (prev. MATIC) price prediction 2026, 2027-2030, we will analyze the price patterns of POL by using accurate trader-friendly technical analysis indicators and predict the future movement of the cryptocurrency.
|
TABLE OF CONTENTS
|
|
INTRODUCTION
|
|
|
POL (prev. MATIC) PRICE PREDICTION 2026
|
|
| POL (prev. MATIC) PRICE PREDICTION 2027, 2028-2030 |
| CONCLUSION |
| FAQ |
POL (prev. MATIC) Current Market Status
| Current Price | $0.1770 |
| 24 – Hour Price Change | 19.39% Up |
| 24 – Hour Trading Volume | $507.78M |
| Market Cap | $1.87B |
| Circulating Supply | 10.56B POL |
| All – Time High | $1.29 (On March 14, 2024) |
| All – Time Low | $0.09846 (On Jan 01, 2026) |
What is POL (prev. MATIC)
| TICKER | POL |
| BLOCKCHAIN | Polygon |
| CATEGORY | Ethereum Scaling Solution |
| ORIGIN DATE | April 2019 |
| UTILITIES | Governance, security, gas fees & rewards |
POL (prev. MATIC) is the native cryptocurrency of the Polygon Network. It was launched as an ERC-20 token in 2019. Polygon, formerly known as the MATIC Network, is a layer-2 blockchain that uses a proof-of-stake consensus mechanism.
POL (prev. MATIC) serves as the primary payment token and governance token on the Polygon Network. Users use POL tokens as transaction fees and also gain voting rights on the network. The core Polygon software development kit (SDK) aids the creation and development of decentralized side chains that are interoperable and compatible with the Ethereum blockchain. Significantly, this Ethereum scaling blockchain recently changed the token’s ticker from MATIC to POL.
POL (prev. MATIC) 24H Technicals
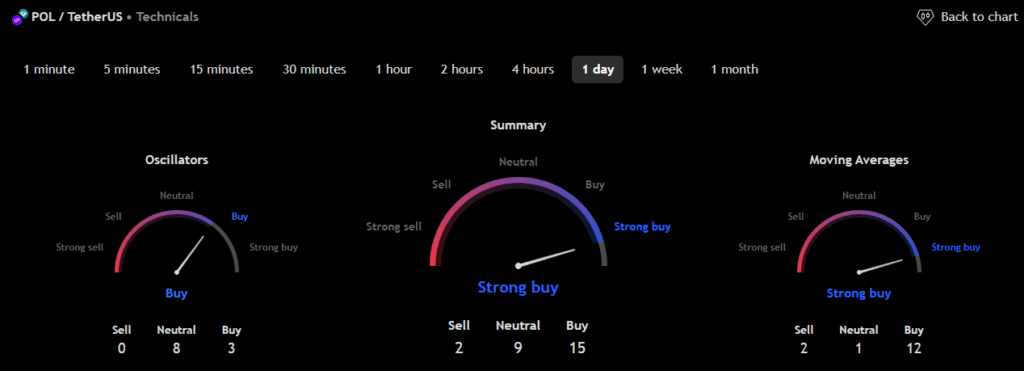 (Source: TradingView)
POL (prev. MATIC) Price Prediction 2026
POL (prev. MATIC) ranks 42nd on CoinMarketCap in terms of its market capitalization. The overview of the POL (prev. MATIC) price prediction for 2026 is explained below with a daily time frame.
In the above chart, POL (prev. MATIC) laid out a descending channel pattern. Descending channel patterns are short-term bearish in that a stock moves lower within a descending channel, but they often form longer-term uptrends as continuation patterns. Higher prices often follow the descending channel pattern. But only after an upside penetration of the upper trend line. A descending channel is drawn by connecting the lower highs and lower lows of a security’s price with parallel trendlines to show a downward trend.
A trader could make a selling bet within a descending channel when the security price reaches its resistance trendline. An ascending channel is the opposite of a descending channel. Both ascending and descending channels are primary channels followed by technical analysts.
At the time of analysis, the price of POL (prev. MATIC) was recorded at $0.1770. If the pattern trend continues, then the price of POL might reach the resistance levels of $0.1752, $0.3104 and $0.5280. If the trend reverses, then the price of POL may fall to the support level of $0.0995.
POL (prev. MATIC) Resistance and Support Levels
The chart given below elucidates the possible resistance and support levels of POL (prev. MATIC) in 2026.
From the above chart, we can analyze and identify the following as resistance and support levels of POL (prev. MATIC) for 2026.
| Resistance Level 1 | $0.1867 |
| Resistance Level 2 | $0.2538 |
| Support Level 1 | $0.1390 |
| Support Level 2 | $0.1006 |
POL Resistance & Support Levels
POL (prev. MATIC) Price Prediction 2026 — RVOL, MA, and RSI
The technical analysis indicators such as Relative Volume (RVOL), Moving Average (MA), and Relative Strength Index (RSI) of POL (prev. MATIC) are shown in the chart below.
From the readings on the chart above, we can make the following inferences regarding the current POL (prev. MATIC) market in 2026.
| INDICATOR | PURPOSE | READING | INFERENCE |
| 50-Day Moving Average (50MA) | Nature of the current trend by comparing the average price over 50 days | 50 MA =$0.1225Price = $0.1698 (50MA < Price) |
Bullish/Uptrend |
| Relative Strength Index (RSI) | Magnitude of price change;Analyzing oversold & overbought conditions | 83.4593 <30 = Oversold50-70 = Neutral>70 = Overbought |
Overbought |
| Relative Volume (RVOL) | Asset’s trading volume in relation to its recent average volumes | Below cutoff line | Weak volume |
POL (prev. MATIC) Price Prediction 2026 — ADX, RVI
In the below chart, we analyze the strength and volatility of POL (prev. MATIC) using the following technical analysis indicators — Average Directional Index (ADX) and Relative Volatility Index (RVI).
From the readings on the chart above, we can make the following inferences regarding the price momentum of POL (prev. MATIC).
| INDICATOR | PURPOSE | READING | INFERENCE |
| Average Directional Index (ADX) | Strength of the trend momentum | 41.8861 | Weak Trend |
| Relative Volatility Index (RVI) | Volatility over a specific period | 83.96 <50 = Low >50 = High |
Low Volatility |
Comparison of POL with BTC, ETH
Let us now compare the price movements of POL (prev. MATIC) with those of Bitcoin (BTC) and Ethereum (ETH).
From the above chart, we can interpret that the price action of POL is similar to that of BTC and ETH. That is, when the price of BTC and ETH increases or decreases, the price of POL also increases or decreases, respectively.
POL (prev. MATIC) Price Prediction 2027, 2028 – 2030
With the help of the aforementioned technical analysis indicators and trend patterns, let us predict the price of POL (prev. MATIC) between 2027, 2028, 2029 and 2030.
| Year | Bullish Price | Bearish Price |
| POL (prev. MATIC) Price Prediction 2027 | $1.3 | $0.09 |
| POL (prev. MATIC) Price Prediction 2028 | $1.5 | $0.08 |
| POL (prev. MATIC) Price Prediction 2029 | $1.7 | $0.07 |
| POL (prev. MATIC) Price Prediction 2030 | $1.9 | $0.06 |
Conclusion
If POL (prev. MATIC) establishes itself as a good investment in 2026, this year would be favorable to the cryptocurrency. In conclusion, the bullish POL (prev. MATIC) price prediction for 2026 is $0.2538. Comparatively, if unfavorable sentiment is triggered, the bearish POL (prev. MATIC) price prediction for 2026 is $0.1006.
If the market momentum and investors’ sentiment positively elevate, then POL (prev. MATIC) might hit $1. Furthermore, with future upgrades and advancements in the Polygon ecosystem, POL might surpass its current all-time high (ATH) of $1.29 and mark its new ATH.
FAQ
1. What is POL (prev. MATIC)?
POL (prev. MATIC) is the native utility token of Polygon, a layer 2 blockchain that is secured by the proof-of-stake (PoS) consensus. It is primarily a payment cryptocurrency and is used as a transaction fee on its blockchain.
2. Where can you purchase POL (prev. MATIC)?
Traders can trade POL (prev. MATIC) on the following cryptocurrency exchanges such as Binance, OKX, Cointr Pro, Bybit, and Bitunix.
3. Will POL (prev. MATIC) reach a new ATH soon?
With the ongoing developments and upgrades within the Polygon platform, POL (prev. MATIC) has a high possibility of reaching its ATH soon.
4. What is the current all-time high (ATH) of POL (prev. MATIC)?
Polygon (MATIC) hit its current all-time high (ATH) of $1.29 on March 14, 2024
5. What is the lowest price of POL (prev. MATIC)?
According to CoinMarketCap, POL hit its all-time low (ATL) of $0.09846 on January 01, 2026.
6. Will POL (prev. MATIC) reach $1?
If the bullish trend continues and if POL (prev. MATIC) retests its resistance levels, it will hit $1 soon.
7. What will be POL (prev. MATIC) price by 2027?
POL (prev. MATIC) price is expected to reach $1.3 by 2027.
8. What will be POL (prev. MATIC) price by 2028?
POL (prev. MATIC) price is expected to reach $1.5 by 2028.
9. What will be POL (prev. MATIC) price by 2029?
POL (prev. MATIC) price is expected to reach $1.7 by 2029.
10. What will be POL (prev. MATIC) price by 2030?
POL (prev. MATIC) price is expected to reach $1.9 by 2030.
Top Crypto Predictions
Avalanche (AVAX) Price Prediction
Bitget Token (BGB) Price Prediction
Sui (SUI) Price Prediction
Disclaimer: The opinion expressed in this chart is solely the author’s. It does not represent any investment advice. TheNewsCrypto team encourages all to do their own research before investing.
You May Also Like

CEO Sandeep Nailwal Shared Highlights About RWA on Polygon

USD/CAD Consolidation Holds with Firm Support – Scotiabank’s Crucial Analysis