The post U.S. Treasury Buys Back $2.8 Billion in Debt Securities appeared first on Coinpedia Fintech News The U.S. Treasury recently repurchased $2.8 billion ofThe post U.S. Treasury Buys Back $2.8 Billion in Debt Securities appeared first on Coinpedia Fintech News The U.S. Treasury recently repurchased $2.8 billion of

U.S. Treasury Buys Back $2.8 Billion in Debt Securities

CLARITY Act

The post U.S. Treasury Buys Back $2.8 Billion in Debt Securities appeared first on Coinpedia Fintech News

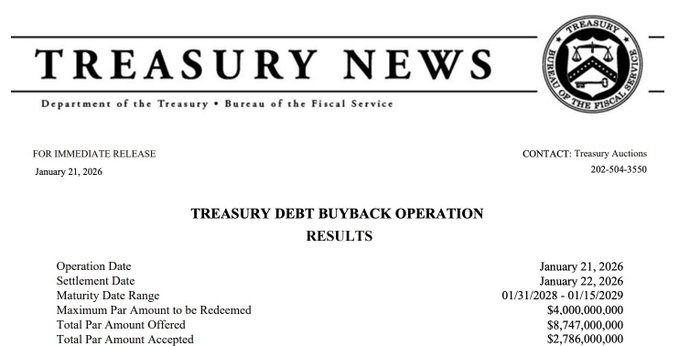
The U.S. Treasury recently repurchased $2.8 billion of its own debt, a move that sent a strong signal across bond markets. While bond yields stayed steady near 4.25%, showing no panic or stress. 

These buybacks help manage liquidity, but also change how investors think about the crypto market next.

U.S. Treasury Buys Back $2.8 Billion

The U.S. Treasury is again buying back its own debt, including a recent $2.8 billion purchase of bonds due in 2028–2029. However, the dealer has offered about $8.7 billion, but the Treasury accepted only 32%, showing a careful and targeted approach to improve trading in less active bonds.

The Treasury has not always used buybacks. Between 2000 and 2002, the Treasury bought back over $67.5 billion in debt to improve liquidity and manage maturities. After many quiet years, buybacks returned as market conditions changed.

U.S. Treasury Buys Back $2.8 Billion in Debt Securities

Last year, in 2025, the Treasury carried out its largest buyback ever, repurchasing $10 billion in debt from $22.87 billion in offers. 

This showed strong demand from institutions and a growing use of buybacks to manage the bond market.

Bond Yields Remain Stable at 4.25%

After the buyback, Treasury yields stayed near 4.25%. This showed that markets were not shocked by the move. Some investors saw it as a sign of strength, while others raised concerns about long-term demand for U.S. debt.

Still, the steady yield suggests confidence that the government is managing its debt carefully.

Unlike Federal Reserve actions such as quantitative easing, this buyback used existing cash, not newly created money. 

What This Means For Crypto Market 

Many in the crypto community see these moves as part of “macro liquidity conditions” that influence crypto prices. When liquidity tightens and yields rise, crypto often weakens. 

But if bond markets show stress or if yields fall, capital can rotate back into Bitcoin and other digital assets.

Meanwhile, U.S. debt buybacks don’t just affect bonds. They change how money flows in global markets, and that flow reaches crypto, too. As of now, the total crypto market cap has seen a slight rise to $3.2 trillion

Market Opportunity
Union Logo
Union Price(U)
$0.002111
$0.002111$0.002111
-9.55%
USD
Union (U) Live Price Chart
Disclaimer: The articles reposted on this site are sourced from public platforms and are provided for informational purposes only. They do not necessarily reflect the views of MEXC. All rights remain with the original authors. If you believe any content infringes on third-party rights, please contact service@support.mexc.com for removal. MEXC makes no guarantees regarding the accuracy, completeness, or timeliness of the content and is not responsible for any actions taken based on the information provided. The content does not constitute financial, legal, or other professional advice, nor should it be considered a recommendation or endorsement by MEXC.

You May Also Like

Bitcoin ETFs Surge with 20,685 BTC Inflows, Marking Strongest Week

Bitcoin ETFs Surge with 20,685 BTC Inflows, Marking Strongest Week

TLDR Bitcoin ETFs recorded their strongest weekly inflows since July, reaching 20,685 BTC. U.S. Bitcoin ETFs contributed nearly 97% of the total inflows last week. The surge in Bitcoin ETF inflows pushed holdings to a new high of 1.32 million BTC. Fidelity’s FBTC product accounted for 36% of the total inflows, marking an 18-month high. [...] The post Bitcoin ETFs Surge with 20,685 BTC Inflows, Marking Strongest Week appeared first on CoinCentral.
Share
Coincentral2025/09/18 02:30
XAG/USD retreats toward $113.00 on profit-taking pressure

XAG/USD retreats toward $113.00 on profit-taking pressure

The post XAG/USD retreats toward $113.00 on profit-taking pressure appeared on BitcoinEthereumNews.com. Silver price (XAG/USD) halts its seven-day winning streak
Share
BitcoinEthereumNews2026/01/30 10:21
BTC Leverage Builds Near $120K, Big Test Ahead

BTC Leverage Builds Near $120K, Big Test Ahead

The post BTC Leverage Builds Near $120K, Big Test Ahead appeared on BitcoinEthereumNews.com. Key Insights: Heavy leverage builds at $118K–$120K, turning the zone into Bitcoin’s next critical resistance test. Rejection from point of interest with delta divergences suggests cooling momentum after the recent FOMC-driven spike. Support levels at $114K–$115K may attract buyers if BTC fails to break above $120K. BTC Leverage Builds Near $120K, Big Test Ahead Bitcoin was trading around $117,099, with daily volume close to $59.1 billion. The price has seen a marginal 0.01% gain over the past 24 hours and a 2% rise in the past week. Data shared by Killa points to heavy leverage building between $118,000 and $120,000. Heatmap charts back this up, showing dense liquidity bands in that zone. Such clusters of orders often act as magnets for price action, as markets tend to move where liquidity is stacked. Price Action Around the POI Analysis from JoelXBT highlights how Bitcoin tapped into a key point of interest (POI) during the recent FOMC-driven spike. This move coincided with what was called the “zone of max delta pain”, a level where aggressive volume left imbalances in order flow. Source: JoelXBT /X Following the test of this area, BTC faced rejection and began to pull back. Delta indicators revealed extended divergences, with price rising while buyer strength weakened. That mismatch suggests demand failed to keep up with the pace of the rally, leaving room for short-term cooling. Resistance and Support Levels The $118K–$120K range now stands as a major resistance band. A clean move through $120K could force leveraged shorts to cover, potentially driving further upside. On the downside, smaller liquidity clusters are visible near $114K–$115K. If rejection holds at the top, these levels are likely to act as the first supports where buyers may attempt to step in. Market Outlook Bitcoin’s next decisive move will likely form around the…
Share
BitcoinEthereumNews2025/09/18 16:40