The charts are lining up around an important moment for the ZEC price. After weeks of sideways and choppy action, Zcash is now sitting at a level that could eitherThe charts are lining up around an important moment for the ZEC price. After weeks of sideways and choppy action, Zcash is now sitting at a level that could either

Zcash (ZEC) Price Reaches a Key “Moment of Truth” – Is a Bullish Pennant Forming?

The charts are lining up around an important moment for the ZEC price. After weeks of sideways and choppy action, Zcash is now sitting at a level that could either support a rebound or lead to another move lower.

On the lower-timeframe chart, the ZEC price is hovering around the $360–$370 area, a zone that has acted as a pivot multiple times. This is where traders are watching closely to see if a higher low can form. Holding this range keeps the recovery structure in place, while losing it would shift attention back toward lower support zones.

Zcash Short-Term Levels That Matter Most

The 4-hour chart shared by Sjuul gives a clean roadmap. Support sits around $360–$370, which is where the ZEC price is currently trying to hold its ground. Above that, the next major hurdle comes in near $460, a level that has capped rallies in the past.

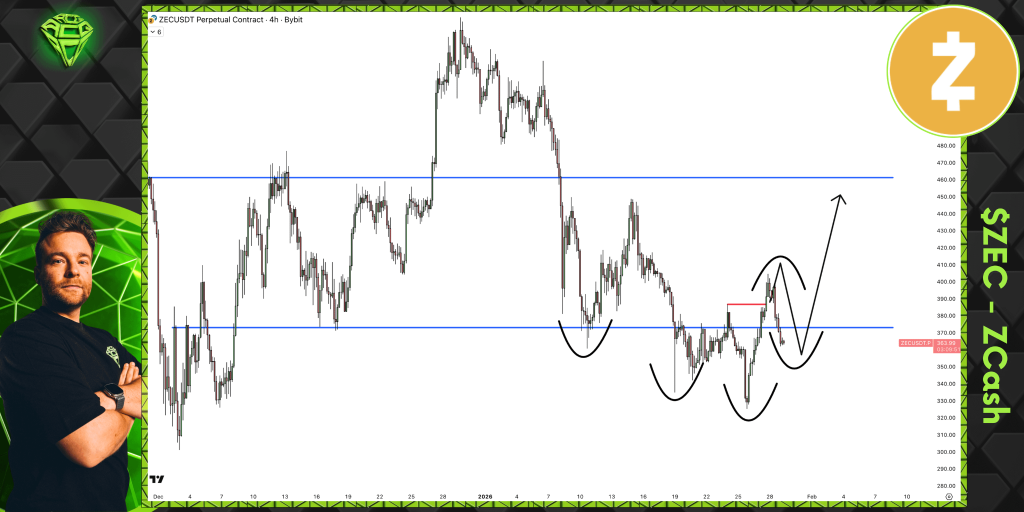
Source: X/@AltCryptoGems

There is also a clear invalidation level on the chart. A breakdown below $320 would invalidate the higher-low idea and shift the structure back toward a more bearish setup. That does not mean price is headed there, but it is the line that separates recovery from failure.

For the bullish scenario to materialize, ZEC needs to recover $370 and follow through. If so, a move to the high $300s and then testing the $460 resistance level is not entirely far-fetched.

The ZEC Daily Chart Shows the Bigger Picture

Zooming out to the daily chart shared by BitcoinCensus changes the perspective. The Zcash price has been trading within a wide bullish flag-like formation over the past months after a strong rally in the earlier stages of the cycle. The price is still trading within the flag formation. Therefore, it is likely to experience some minor corrections.

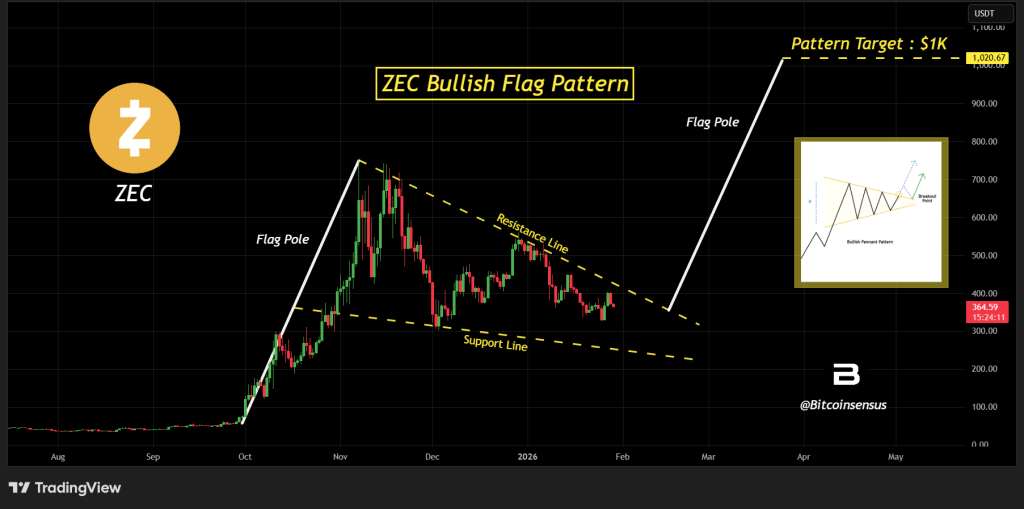
Source: X/@Bitcoinsensus

The long-term projection from this pattern points toward $1,000, but that is clearly a macro target, and not something expected in the near term. 

For that scenario to even come into play, the ZEC price would need to reclaim several major resistance zones and eventually break out of the larger structure with momentum.

Read Also: $KAS Price Prediction – $5,000 in Kaspa Now, How Much Could It Be Worth by 2027?

What to Watch Next for the ZEC Price

The big question in the short term is whether ZEC can continue to trade above the $360 to $370 level and keep the level around $320 at bay.

If that level continues to hold, the charts do indicate that ZEC could move back up towards the $400 level, perhaps facing resistance at the $460 level in the process.

Subscribe to our YouTube channel for daily crypto updates, market insights, and expert analysis.

The post Zcash (ZEC) Price Reaches a Key “Moment of Truth” – Is a Bullish Pennant Forming? appeared first on CaptainAltcoin.

Disclaimer: The articles reposted on this site are sourced from public platforms and are provided for informational purposes only. They do not necessarily reflect the views of MEXC. All rights remain with the original authors. If you believe any content infringes on third-party rights, please contact service@support.mexc.com for removal. MEXC makes no guarantees regarding the accuracy, completeness, or timeliness of the content and is not responsible for any actions taken based on the information provided. The content does not constitute financial, legal, or other professional advice, nor should it be considered a recommendation or endorsement by MEXC.

You May Also Like

Bitcoin ETFs Surge with 20,685 BTC Inflows, Marking Strongest Week

Bitcoin ETFs Surge with 20,685 BTC Inflows, Marking Strongest Week

TLDR Bitcoin ETFs recorded their strongest weekly inflows since July, reaching 20,685 BTC. U.S. Bitcoin ETFs contributed nearly 97% of the total inflows last week. The surge in Bitcoin ETF inflows pushed holdings to a new high of 1.32 million BTC. Fidelity’s FBTC product accounted for 36% of the total inflows, marking an 18-month high. [...] The post Bitcoin ETFs Surge with 20,685 BTC Inflows, Marking Strongest Week appeared first on CoinCentral.
Share
Coincentral2025/09/18 02:30
XAG/USD retreats toward $113.00 on profit-taking pressure

XAG/USD retreats toward $113.00 on profit-taking pressure

The post XAG/USD retreats toward $113.00 on profit-taking pressure appeared on BitcoinEthereumNews.com. Silver price (XAG/USD) halts its seven-day winning streak
Share
BitcoinEthereumNews2026/01/30 10:21
BTC Leverage Builds Near $120K, Big Test Ahead

BTC Leverage Builds Near $120K, Big Test Ahead

The post BTC Leverage Builds Near $120K, Big Test Ahead appeared on BitcoinEthereumNews.com. Key Insights: Heavy leverage builds at $118K–$120K, turning the zone into Bitcoin’s next critical resistance test. Rejection from point of interest with delta divergences suggests cooling momentum after the recent FOMC-driven spike. Support levels at $114K–$115K may attract buyers if BTC fails to break above $120K. BTC Leverage Builds Near $120K, Big Test Ahead Bitcoin was trading around $117,099, with daily volume close to $59.1 billion. The price has seen a marginal 0.01% gain over the past 24 hours and a 2% rise in the past week. Data shared by Killa points to heavy leverage building between $118,000 and $120,000. Heatmap charts back this up, showing dense liquidity bands in that zone. Such clusters of orders often act as magnets for price action, as markets tend to move where liquidity is stacked. Price Action Around the POI Analysis from JoelXBT highlights how Bitcoin tapped into a key point of interest (POI) during the recent FOMC-driven spike. This move coincided with what was called the “zone of max delta pain”, a level where aggressive volume left imbalances in order flow. Source: JoelXBT /X Following the test of this area, BTC faced rejection and began to pull back. Delta indicators revealed extended divergences, with price rising while buyer strength weakened. That mismatch suggests demand failed to keep up with the pace of the rally, leaving room for short-term cooling. Resistance and Support Levels The $118K–$120K range now stands as a major resistance band. A clean move through $120K could force leveraged shorts to cover, potentially driving further upside. On the downside, smaller liquidity clusters are visible near $114K–$115K. If rejection holds at the top, these levels are likely to act as the first supports where buyers may attempt to step in. Market Outlook Bitcoin’s next decisive move will likely form around the…
Share
BitcoinEthereumNews2025/09/18 16:40