

Bitcoin Is Sending Mixed Signals – Here Are Three Perspectives Worth Considering
Key Takeaways
- Bitcoin is forming a third bull trap pattern near $71K – a structure that preceded sharp drops twice before
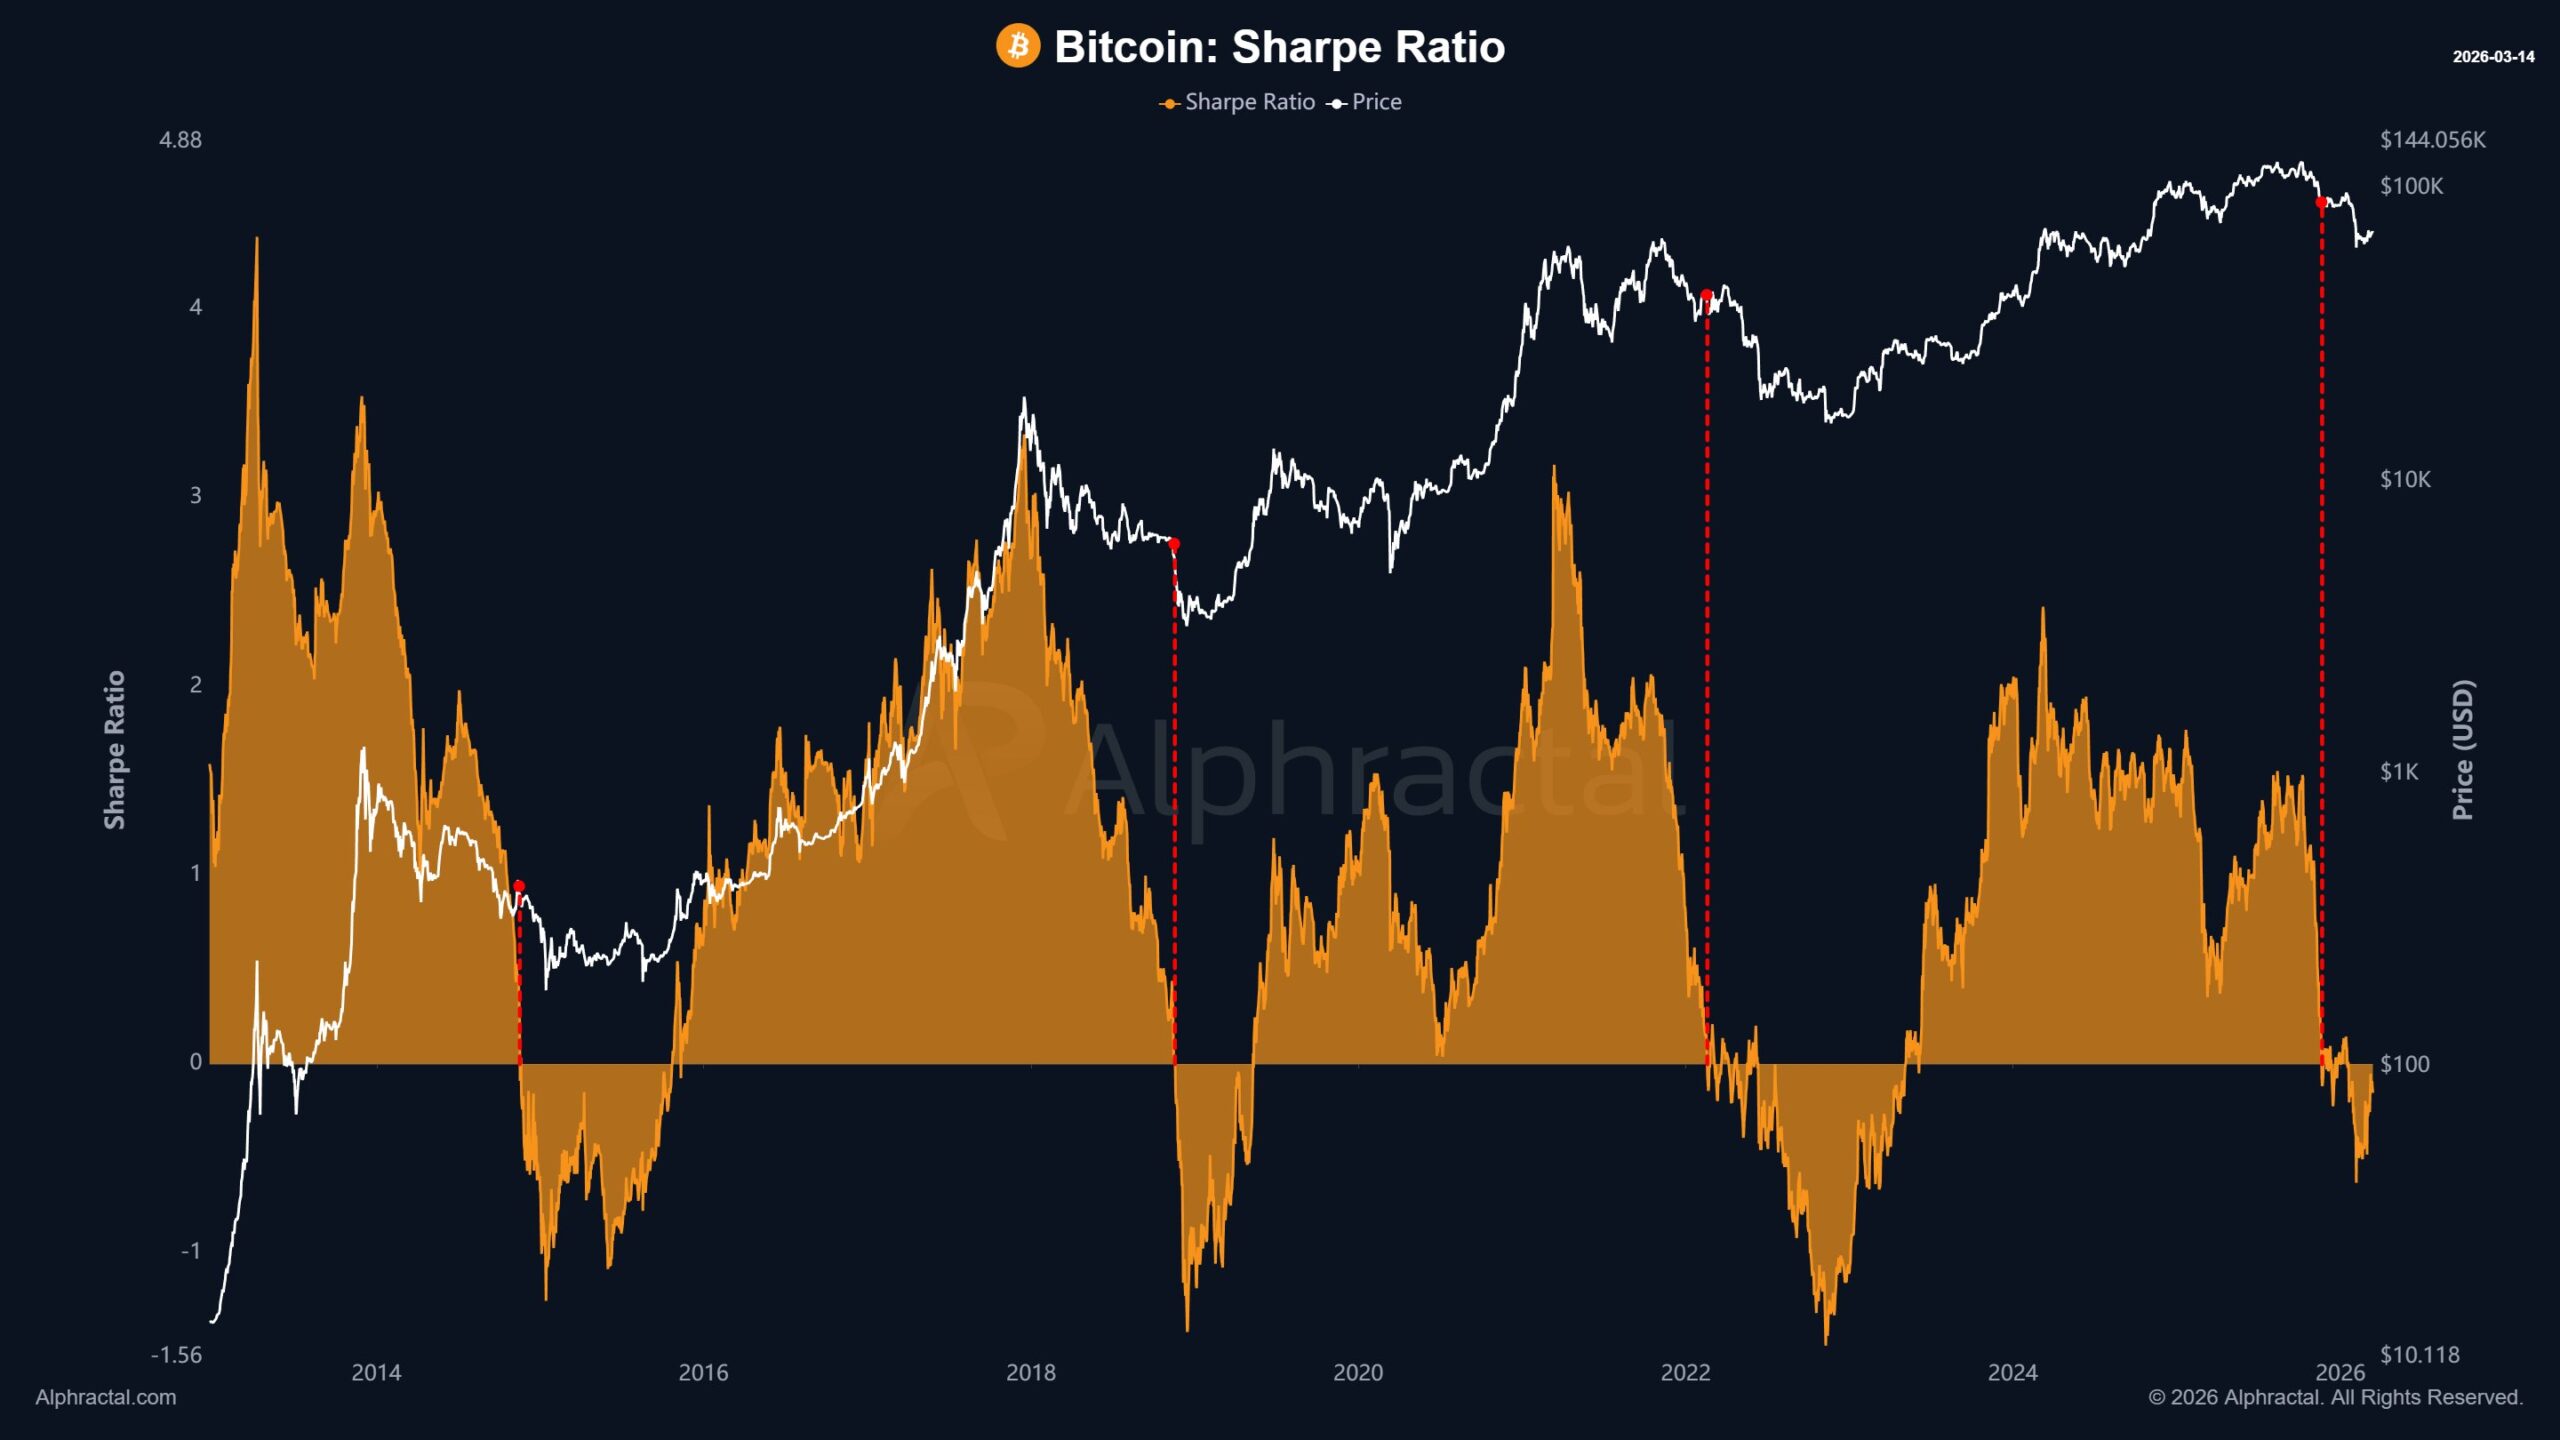
- The Sharpe Ratio has turned negative, historically marking both peak danger and peak opportunity
- Long-Term Holder MVRV is trending toward the 0.85 accumulation zone seen at cycle bottoms
- The next 60–90 days could define whether this is a buying opportunity or the beginning of a deeper correction
Three separate data points, from chart patterns to on-chain metrics, are converging on the same uncomfortable question: is Bitcoin setting up for a real breakout, or is it walking into another trap?
The Bull Trap Nobody Wants to Talk About
Crypto analyst Merlijn The Trader flagged something worth paying attention to on March 15. Looking at Bitcoin’s daily chart, he identified three near-identical patterns playing out across different time periods – each one resembling a breakout, each one ending lower.
The structure is a rising wedge followed by a sharp breakdown. Pattern one formed near the cycle highs. Pattern two appeared mid-correction. Pattern three is forming right now, around $71K.
The math is simple and brutal. A close above $74K invalidates the setup – bulls take control and the thesis breaks down. A close below $68K activates the trap, and historical precedent points to $62K as the next logical target.
What makes this worth taking seriously isn’t the prediction itself – it’s the repetition. Markets tend to punish the same mistake twice. Doing it three times is a choice.
The Sharpe Ratio Is Flashing Yellow
On-chain analytics firm Alphractal added another layer to the picture. Bitcoin’s Sharpe Ratio – a measure of return relative to risk – has turned negative.
 Source: https://x.com/Alphractal/status/2032985443189330194
That’s not a minor technical footnote. Every previous instance of a negative Sharpe Ratio in Bitcoin’s history has corresponded with a period of significant price weakness. The deteriorating risk-to-reward profile tends to accelerate selling as institutional and sophisticated retail money rotates out.
But here’s where the interpretation gets more nuanced. Those same windows of negative Sharpe Ratio have historically also marked some of the best entry points of entire market cycles. The catch: you have to be willing to sit in drawdown for months, sometimes longer, before that thesis potentially pays off.
READ MORE:
Gold Outperforms Bitcoin for the First Time in Years – One Chart Is Drawing Comparisons to 1974
The market doesn’t reward patience announced in advance. It could rewards patience demonstrated under pressure.
For short-term traders, a negative Sharpe Ratio is a stop sign. For long-term accumulators with conviction and liquidity, it’s a different signal entirely – one that rarely stays available for long once the crowd figures it out.
The On-Chain Signal Most Retail Traders Have Never Heard Of
The third data point is the most structural. Analyst Joao Wedson has been tracking Bitcoin’s Long-Term Holder MVRV– a ratio that measures the average unrealized profit or loss held by Bitcoin addresses that haven’t moved their coins in over 155 days.
Across three distinct market cycles, cycle bottoms occurred at LTH-MVRV readings of 0.67, 0.72, and 0.78. Each bottom was incrementally higher than the last – a consistent, rising floor that suggests long-term holders are collectively growing more resilient, requiring less drawdown before they stop selling.
If the pattern holds, the next major accumulation zone sits around 0.85. The chart from Alphractal, dated March 15, shows the indicator currently trending in that direction – not at 0.85 yet, but approaching it.
Wedson has set an alert for when the indicator drops below 1.2, using it as an early warning that the market may be entering the zone worth watching closely.
The interpretation here matters: this isn’t a call to buy now. It’s a call to prepare. Accumulation zones don’t announce themselves with green candles and positive sentiment. They arrive quietly, during the period when most market participants have given up or are too scared to act.
What This Means Taken Together
Three signals, three different analysts, three different methodologies – and they’re all pointing to roughly the same setup.
Bitcoin is in a technically fragile position. The bull trap pattern suggests downside risk is real and quantified. The negative Sharpe Ratio confirms that the risk-adjusted math currently doesn’t favor aggressive long exposure. And the LTH-MVRV trajectory suggests that if price does fall further, it may be falling directly into one of the most historically significant accumulation zones of this cycle.
None of this guarantees a specific outcome. Bitcoin has a habit of invalidating clean narratives – it can rip through $74K just as convincingly as it can collapse to $62K. Markets are not obligated to follow patterns, even historically reliable ones.
But what the data does do is provide a framework. The $68K–$74K range is the decision zone. How Bitcoin closes on the weekly within that band in the coming weeks will likely determine whether the current structure resolves bullishly or follows the same script as patterns one and two.
For those managing positions actively: the levels are clear. For those building long-term exposure: the on-chain data is approaching the kind of territory that has rewarded patience in every previous cycle.
The market tends to be most generous precisely when it feels least safe. That’s not optimism – it’s the record.
The information provided in this article is for educational purposes only and does not constitute financial, investment, or trading advice. Coindoo.com does not endorse or recommend any specific investment strategy or cryptocurrency. Always conduct your own research and consult with a licensed financial advisor before making any investment decisions.
The post Bitcoin Is Sending Mixed Signals – Here Are Three Perspectives Worth Considering appeared first on Coindoo.


You May Also Like

MEXC Lists Arcium (ARX) with 70,000 USDT in Airdrop+ Rewards

Ethereum Stablecoin Supply Contracts: USDT Down 2.83%, USDC Down 2.72% Over 30 Days

Morgan Stanley Undercuts Rivals — Launches Ethereum and Solana ETFs


Trending News
More
