

Ethereum Price Extends Decline As $2,220 Support Comes Into Play
Ethereum price started a downside correction below $2,350. ETH is now showing a few bearish signs and might decline further if it trades below $2,265.
- Ethereum started a downside correction below the $2,365 zone.
- The price is trading below $2,320 and the 100-hourly Simple Moving Average.
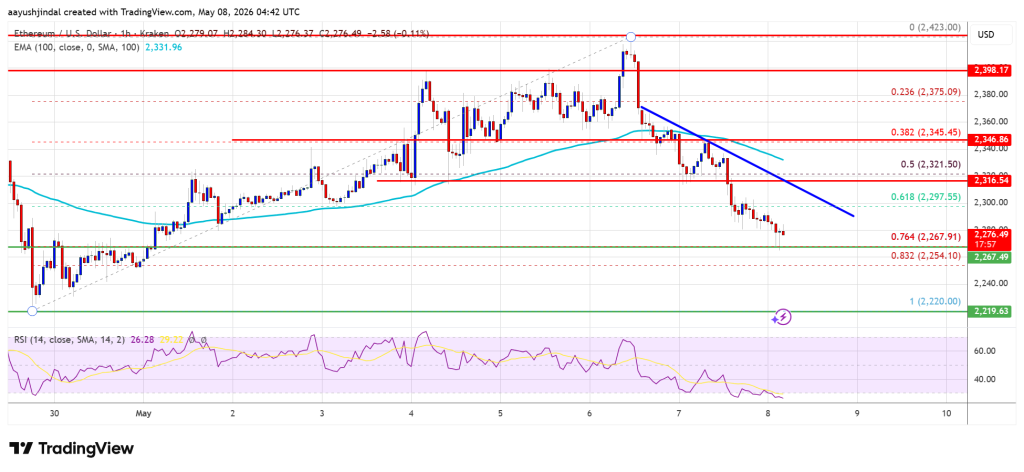
- There is a bearish trend line forming with resistance at $2,315 on the hourly chart of ETH/USD (data feed via Kraken).
- The pair could continue to move down if it stays below the $2,325 zone.
Ethereum Price Dips Further
Ethereum price failed to stay above the $2,350 zone and extended its decline, like Bitcoin. ETH price gained pace for a move below the $2,320 and $2,300 levels.
The bears pushed the price below the 50% Fib retracement level of the upward move from the $2,220 swing low to the $2,423 high. Finally, the bulls appeared near $2,265. Besides, there is a bearish trend line forming with resistance at $2,315 on the hourly chart of ETH/USD.
Ethereum price is now trading below $2,320 and the 100-hourly Simple Moving Average. If the bulls remain in action above $2,265, the price could attempt another increase. Immediate resistance is seen near the $2,300 level. The first key resistance is near the $2,320 level.
The next major resistance is near the $2,350 level. A clear move above the $2,350 resistance might send the price toward the $2,400 resistance. An upside break above the $2,400 region might call for more gains in the coming days. In the stated case, Ether could rise toward the $2,440 resistance zone or even $2,450 in the near term.
Another Decline In ETH?
If Ethereum fails to clear the $2,320 resistance, it could start a fresh decline. Initial support on the downside is near the $2,265 level and the 76.4% Fib retracement level of the upward move from the $2,220 swing low to the $2,423 high. The first major support sits near the $2,240 zone.
A clear move below the $2,240 support might push the price toward the $2,220 support. Any more losses might send the price toward the $2,200 region. The main support could be $2,150.
Technical Indicators
Hourly MACD – The MACD for ETH/USD is gaining momentum in the bearish zone.
Hourly RSI – The RSI for ETH/USD is now below the 50 zone.
Major Support Level – $2,265
Major Resistance Level – $2,320


You May Also Like

Stablecoin yield negotiations are pretty much done, Coinbase CLO Grewal says

ECB rejects stablecoins as a path to wider euro influence


