

GME slips under daily Bollinger band as bears press 22.18 pivot

GME stock near-term tape is fragile after the high-profile eBay gambit. The daily chart sets a bearish bias into midweek, reinforced by an intraday downtrend.
However, the close under the daily lower Bollinger band introduces oversold rebound risk that could complicate entries.
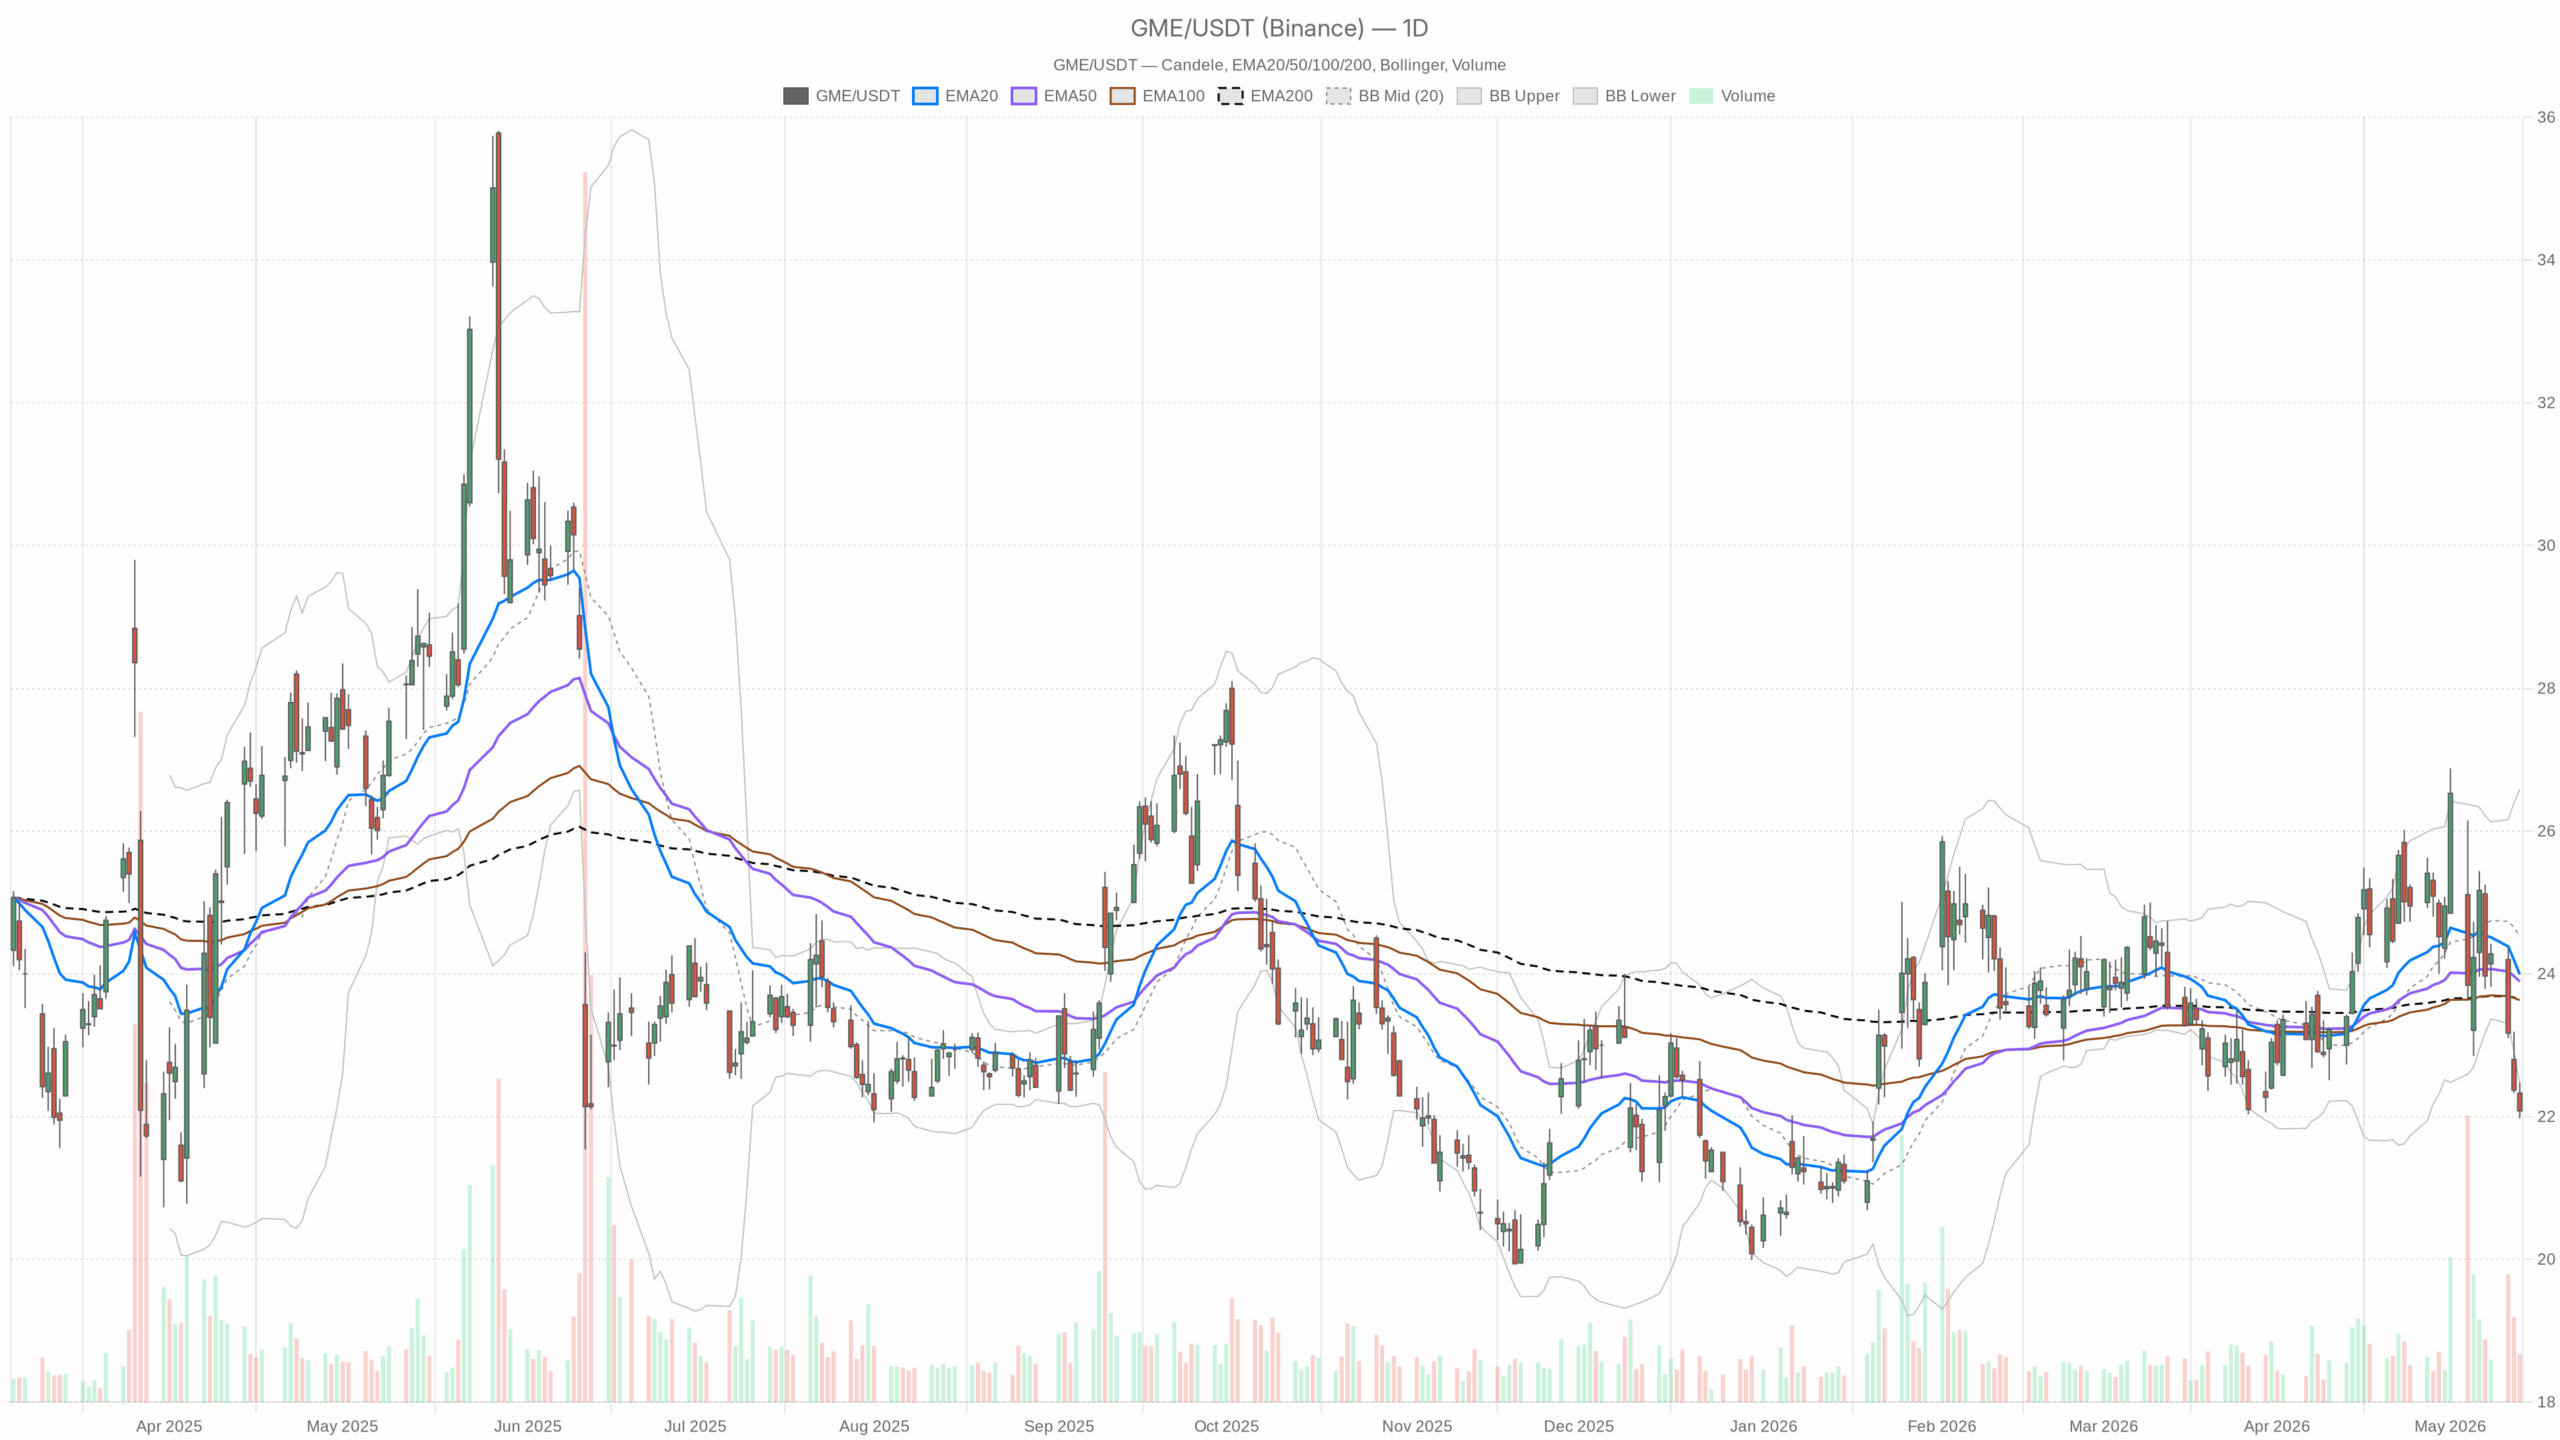 GME — daily chart with candlesticks, EMA20/EMA50 and volume.
GME stock daily technical outlook: momentum slips below bands
Trend gauges and momentum
On the daily timeframe, GME stock closed at 22.08, under the 20/50/200-day EMAs at 23.99/23.89/23.65. That leaves price below all trend gauges and creates overhead supply. RSI(14) is 39.29, showing bearish momentum but not washed out. MACD line -0.24 vs signal 0.12 with histogram -0.36 keeps downside pressure intact.
Bands, volatility, and levels
Bollinger bands center at 24.52 with the lower at 22.45, now breached. That stretch on the downside allows scope for a snapback. ATR(14) sits at 1.2, flagging elevated daily swing risk. The daily pivot is 22.18 with R1 22.38 and S1 21.88, offering clean near-term levels.
GME stock intraday trend: 1H bias remains bearish
Momentum and supply overhead
Meanwhile, the 1H chart stays bearish. Price is 22.09 against EMAs 22.72/23.45/24.03, keeping persistent intraday supply overhead. RSI(14) at 31.79 is weak and near oversold. MACD line -0.48 vs signal -0.47, with a histogram at -0.01, shows flattening selling momentum.
Range, bands, and pivots
Hourly Bollinger mid 22.72 and lower 21.78 frame the range. The downtrend channel leaves room to 21.78 if pressure resumes. ATR(14) at 0.31 signals active but orderly intraday volatility. The 1H pivot is 22.11 with R1 22.17 and S1 22.03, a tight battleground.
15-minute structure: execution context for GME
At the same time, the 15m tape offers execution color rather than a signal. Price hugs the lower band at 22.09 versus 15m EMAs 22.26/22.53/23.53, a weak micro-structure.
RSI(14) at 35.71 is subdued. MACD line equals the signal with a flat histogram at 0, a momentum pause. ATR(14) at 0.10 shows compressed micro swings. The 15m pivot is 22.09, with R1 22.13 and S1 22.05, a scalpers’ line in the sand.
News and sentiment: eBay bid fallout for GME
Notably, the news flow is loud. eBay rejected GameStop’s unsolicited bid and raised financing and governance concerns, creating a sentiment overhang and dilution risk. Ryan Cohen’s sharp response keeps the story live, adding headline volatility. Commentary calling the offer a stunt underscores a credibility gap, so skepticism can cap rallies.
Bullish case: reclaim the GME daily pivot 22.18
Therefore, for the bullish case to gain traction, price needs to re-enter the daily band and reclaim the daily pivot. A push back above 22.18 and then 22.38 would ease immediate pressure. A daily close back above 22.45, the prior lower band, would add credence. On 1H, RSI lifting through the low 40s with a positive MACD cross would argue for a drift toward 22.72. The EMA cluster near 23.65–23.99 is the first resistance zone.
Bearish continuation: failures below 22.18 keep control
On the other hand, bears keep control if price cannot reclaim 22.18 quickly. A breakdown through 22.05–22.03 on the 15m/1H pivots would expose 21.88 on the daily S1 as the next downside waypoint. The hourly lower band near 21.78 sits below that if momentum re-accelerates. Because the daily close is already under its lower band, a grind lower may be choppy and punctuated by brief bounces.
Positioning and risk context for GME
Overall, positioning in this tape leans cautious. Daily ATR near 1.2 and noisy headlines imply elevated execution risk and slippage. Until the daily chart can retake 22.18 and settle back inside its band, the bias remains bearish with oversold snapback risk. Meanwhile, many participants will likely wait for 1H momentum to stabilize.


You May Also Like

Prediction markets get CFTC relief as legal battles widen

Metaplanet Stock: How a 24% Bitcoin Drop Erased Strong Operating Gains


