

MSFT Stock Today: $37B AI Surge Pushes Price Past Bollinger Bands as RSI Hits 73

Microsoft’s aggressive AI expansion has ignited a powerful breakout. For those tracking MSFT stock today, extreme momentum now meets short-term exhaustion. A $37 billion AI run rate and bullish calls from Morgan Stanley and Wells Fargo underscore the surge.
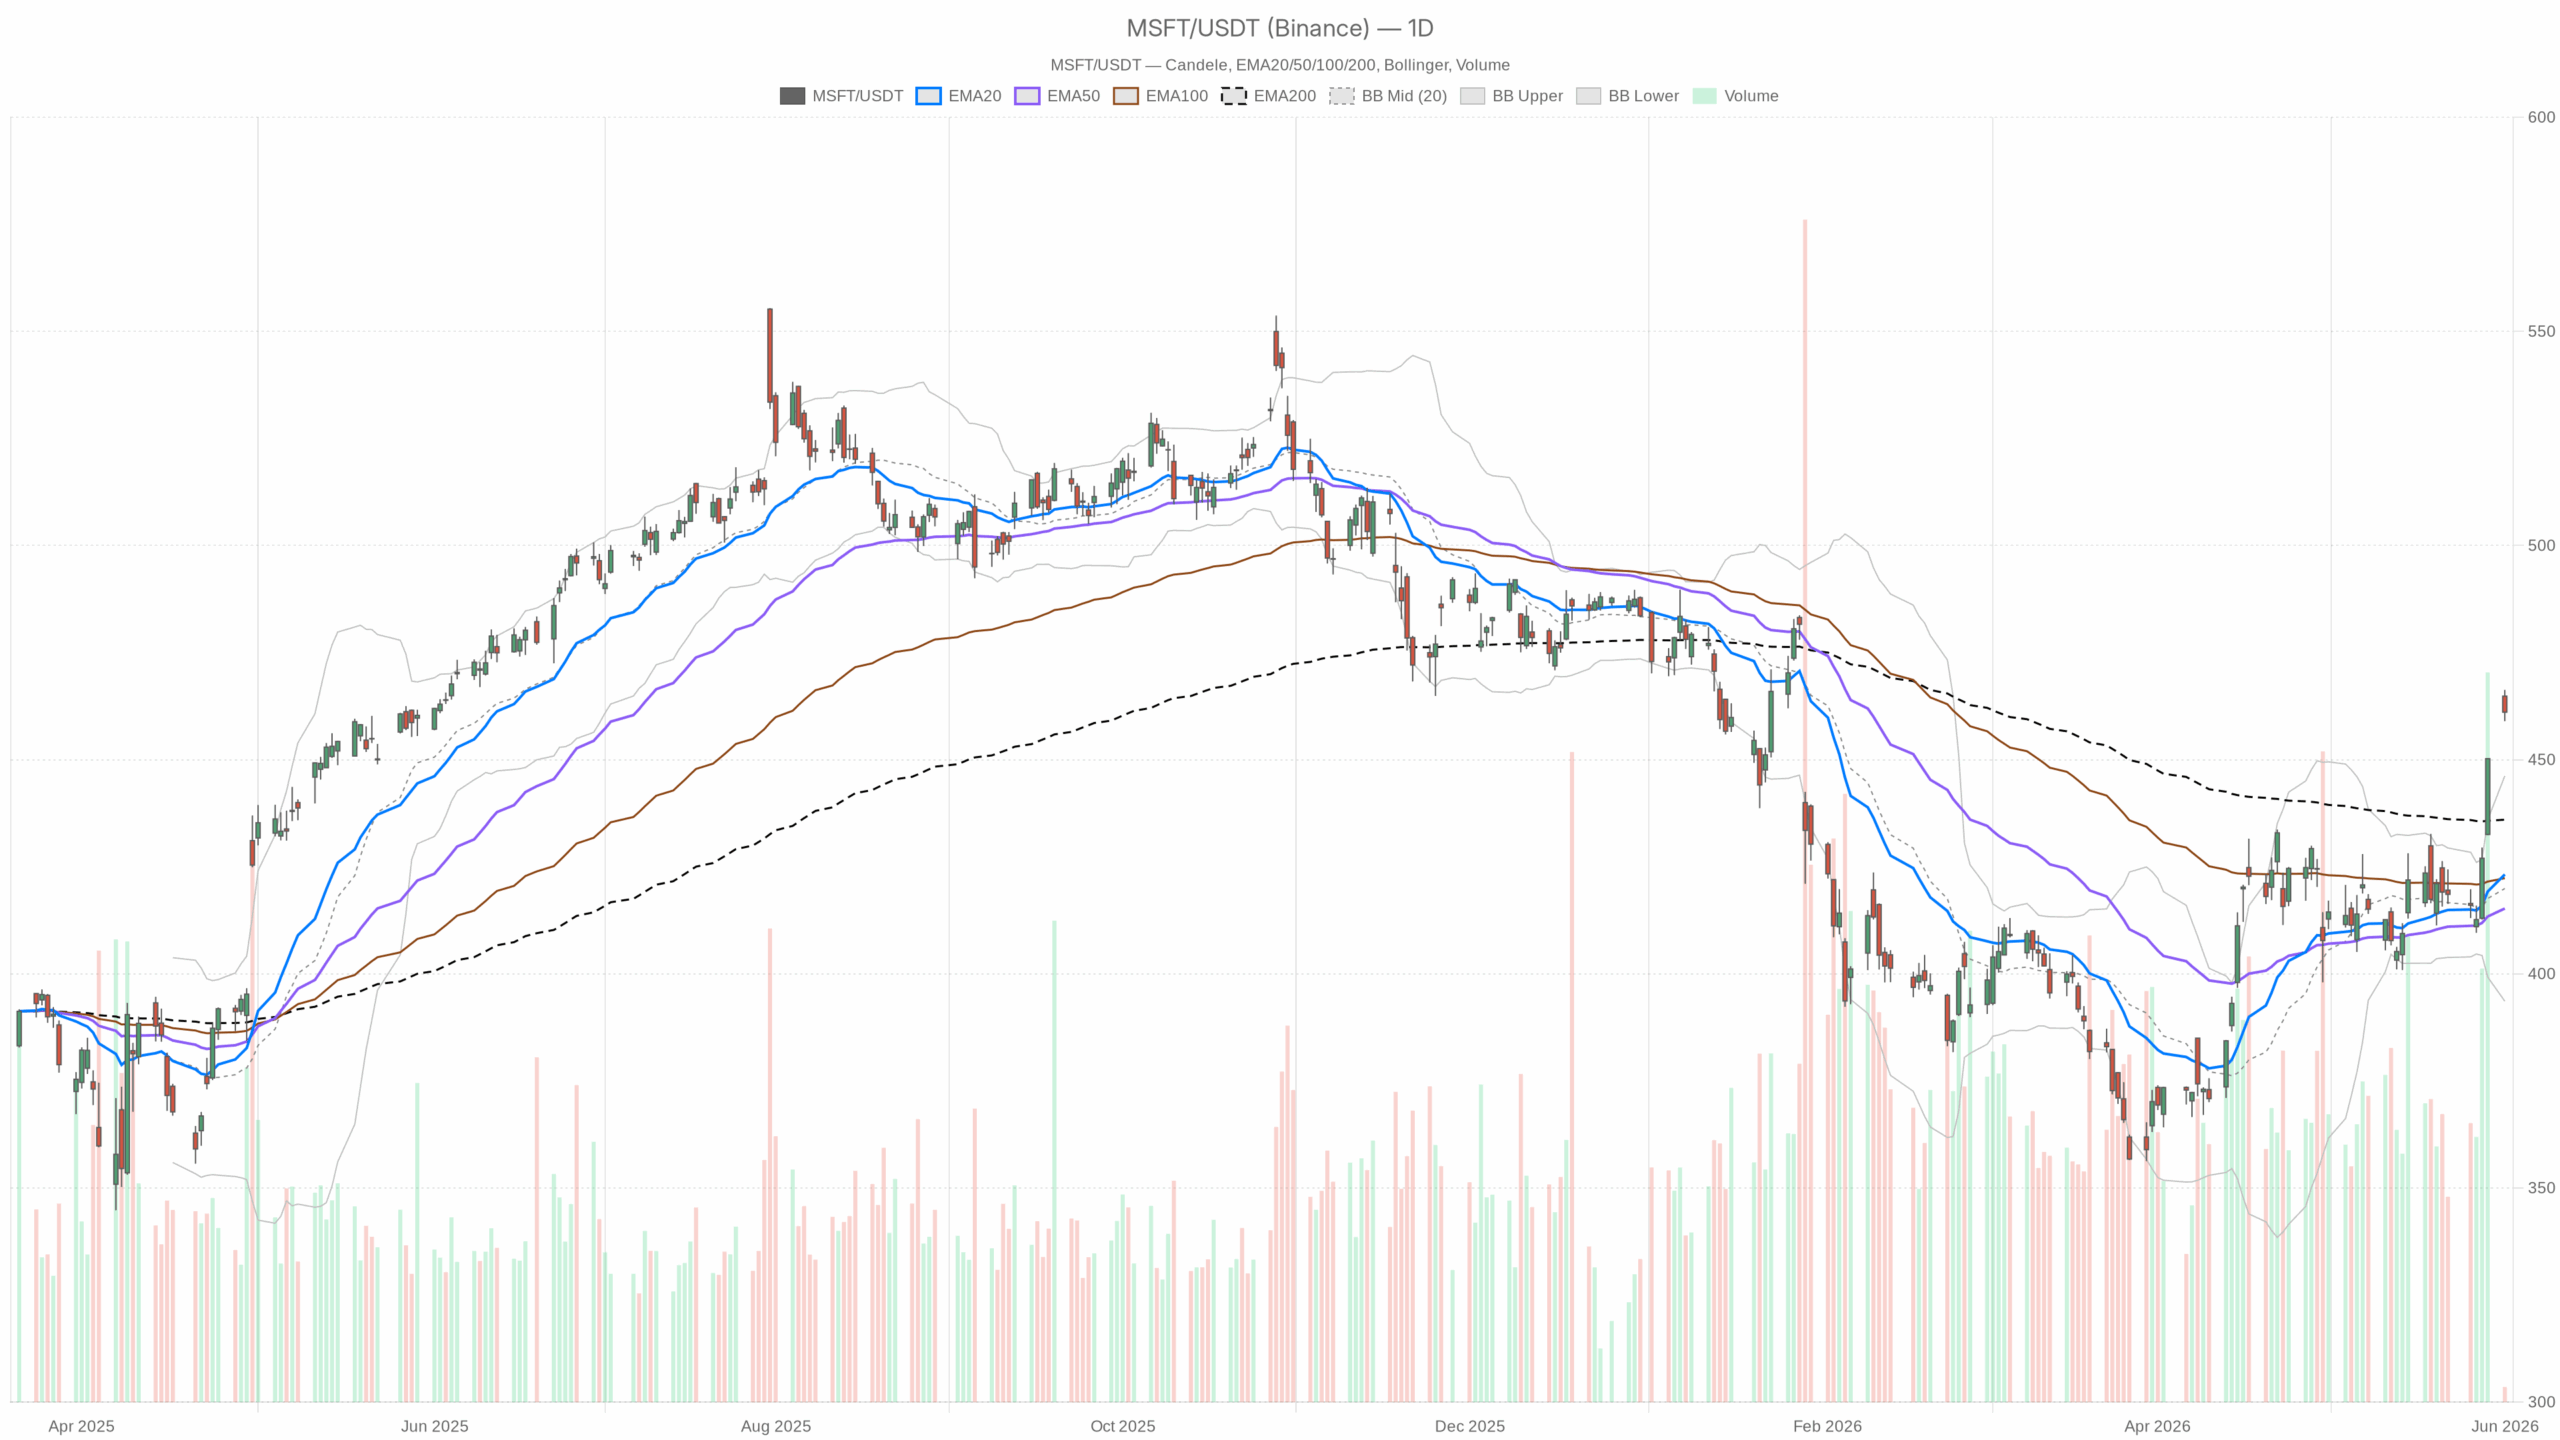 MSFT — daily chart with candlesticks, EMA20/EMA50 and volume.
MSFT Stock Today: AI Catalyst Drives Historic Breakout Beyond Bollinger Bands
On the daily chart, the underlying market stance remains technically neutral. Yet the price action paints a far more aggressive picture. The closing price of 461.1 pushed well beyond the daily Bollinger Band upper limit of 446.23. This vertical move signals that buyers are in full control of the current trend. Such a decisive breach confirms the strength of the AI-driven rally.
Overbought Technical Indicators Warn of Near-Term Exhaustion
RSI and Volatility Signal Cooling Risk
Meanwhile, the daily relative strength index has climbed to an overbought reading of 73.02. This extended level warns that the initial buying frenzy may soon need a breather. At the same time, the daily average true range sits at 12.14, reflecting elevated volatility. Such wide price swings are now typical for the stock. Furthermore, the daily MACD shows a rising histogram at 3.44. This positive momentum confirms the trend remains structurally intact despite stretched valuations.
Hourly Timeframe Confirms Bullish Structure Amid Extremes
Shifting to the hourly chart, the regime is officially bullish. For MSFT, the hourly EMAs are stacked in a perfect bullish alignment. The short-term EMA20 at 437.6 holds comfortably above the slower EMA50 and EMA200. However, the hourly RSI sits in extreme overbought territory at 86.56. This reading suggests that chasing the price at current highs carries elevated risk. The hourly price is hovering right around its daily pivot point of 461.22. Traders should watch this level closely for short-term direction.
15-Minute Chart Shows Intraday Volatility Cooling
On the 15-minute execution chart, volatility is notably cooling down. This intraday cooling is visible through the short-term RSI, which has slipped to 72.43. If buyers want to enter, monitoring this minor pullback is crucial. The intraday support level near 459.12 offers a potential launchpad for the next leg higher. A bounce from this zone would reinforce the bullish structure.
MSFT Stock Today: Bullish and Bearish Scenarios
Therefore, the primary scenario points toward continued upside after a brief consolidation pocket. If MSFT stock can solidify its base above 461, it will likely eye the high of 466.32. A successful push past this level opens the door to testing new historical territory.
In contrast, the bearish scenario hinges on a failure to hold current support. If the price breaks below the key daily support of 457.95, a deeper pullback becomes likely. Under this scenario, the price would return toward the upper Bollinger Band of 446.23. A drop below that key area would invalidate the immediate bullish thesis.
The Verdict: AI Tailwinds vs. Overbought Reality
Overall, Microsoft remains a dominant force driven by undeniable AI tailwinds. Still, the current technical indicators suggest patience before entering new positions. Active management requires balancing this powerful trend against heavily overbought conditions. The breakout is real, but the entry timing demands discipline. For those monitoring MSFT stock today, waiting for a healthy consolidation may offer a better risk-to-reward profile.


You May Also Like

Where SoftBank stands to benefit on Japan’s stablecoin plans

Critical USDT0 Response to Drift Hack Exposes Stark Contrast in Stablecoin Security Protocols

Republicans are ignoring a November threat hiding in the heartland: Washington Post


