

Here’s why DeXe price soared over 50% today
DeXe price has surged 54% to a new yearly high after a technical breakout and a sharp rise in trading volume triggered aggressive buying activity.
- DeXe price surged 54% to a new yearly high as trading volume spiked and resistance levels broke.
- A double-bottom breakout and bullish momentum indicators helped drive aggressive buying pressure.
- Limited exchange supply and short-covering activity amplified the token’s rapid advance.
According to data from crypto.news, DeXe (DEXE) price climbed 54% to an intraday high near $24.70 on June 23, extending gains from the previous session and reaching a new yearly high.
The rally unfolded as spot trading volume surged and buyers rushed into the token after it broke above several technical resistance levels that had capped price action throughout June.
The move came in a market where DeXe’s available trading supply remains relatively limited. A large portion of the token supply is held in ecosystem allocations, treasury wallets, and protocol-controlled addresses, leaving a smaller amount actively circulating on exchanges.
With sell-side liquidity already thin, the influx of buy orders forced traders to pay progressively higher prices, amplifying the upward move.
At the same time, traders holding short positions were caught on the wrong side of the breakout. As resistance levels gave way, liquidations and forced covering added further buying pressure, helping fuel one of DeXe’s strongest daily advances this year.
DeXe price breakout unleashes momentum buying
Technical indicators suggest the rally began before the largest price spike occurred. On the four-hour chart, DeXe completed a double-bottom pattern near the $14 region before breaking above a descending trendline that had guided the downtrend since early June.
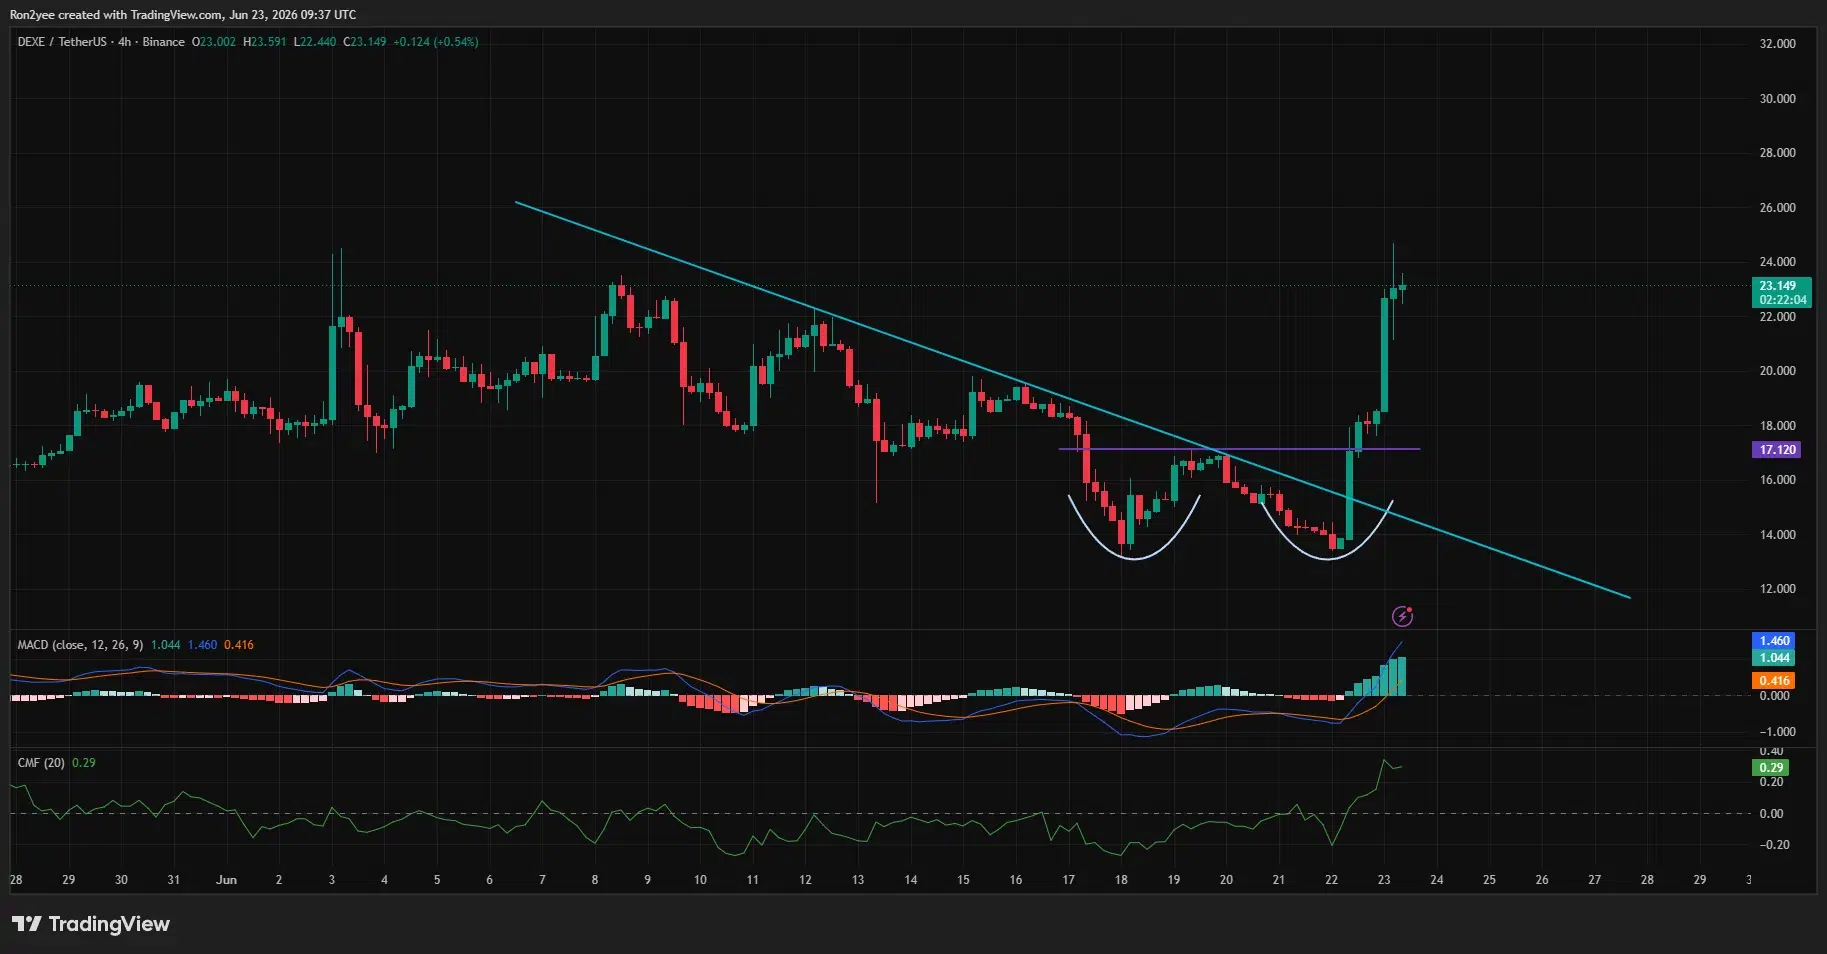
The token then cleared horizontal resistance around $17.12, opening the door for a rapid move into a higher trading range.
Momentum indicators strengthened alongside the breakout. The MACD indicator printed a bullish crossover while its histogram expanded sharply, signaling accelerating upside momentum. Meanwhile, the Chaikin Money Flow indicator climbed well above zero, indicating strong capital inflows into the asset.
As buying intensified, price quickly advanced toward the next major resistance zone near $24.85, a level that coincides with DeXe’s previous yearly peak and the 100% Fibonacci retracement level visible on the weekly chart.
DeXe price approaches major weekly resistance
The longer-term structure also turned more constructive as the rally developed.
The Weekly chart shows DeXe has recovered toward highs established earlier this year rather than entering completely uncharted territory. The token has now reclaimed several key Fibonacci retracement levels, including the 61.8% and 78.6% zones, which traders often monitor during strong recovery trends.
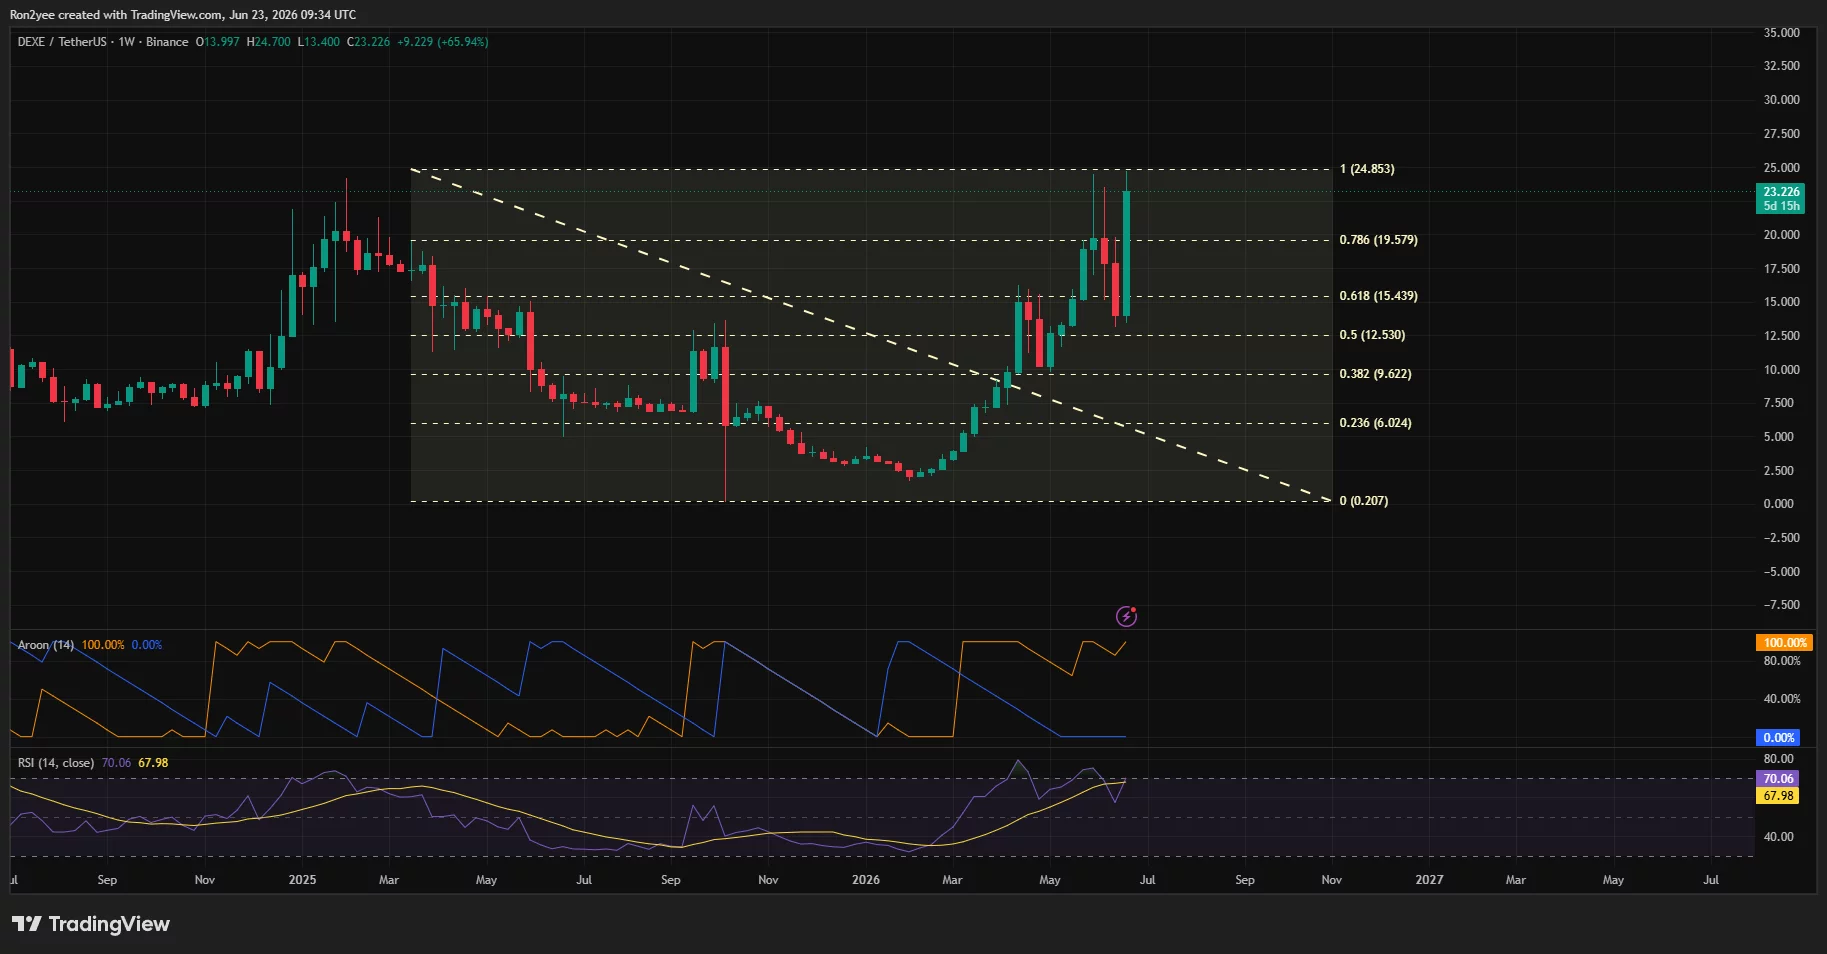
Additional momentum indicators support the bullish backdrop. The weekly Aroon indicator shows Aroon Up at 100 while Aroon Down remains near zero, a configuration typically associated with strong trend conditions. At the same time, the weekly Relative Strength Index has climbed to around 70, indicating strong momentum while approaching overbought territory.
The combination of a constrained tradable supply, a breakout above long-standing resistance, and accelerating momentum indicators created conditions for an unusually powerful rally. With DeXe price now approaching the $24.85 resistance area, traders are watching whether DeXe can establish a foothold above that level or face profit-taking after its rapid advance.
Disclosure: This article does not represent investment advice. The content and materials featured on this page are for educational purposes only.


You May Also Like

Alphabet (GOOGL) Stock Drops 5% as Google Loses Nobel Winner to Anthropic

Franklin Templeton closes 250 Digital acquisition deal and sets up new Franklin Crypto division

GMX perpetual markets expand to MegaETH with Chainlink for real-time DeFi trading


