

Bitcoin OG Whale Who Predicted Last Crash Opens $392M Short — Is Another Crash Coming?

The post Bitcoin OG Whale Who Predicted Last Crash Opens $392M Short — Is Another Crash Coming? appeared first on Coinpedia Fintech News
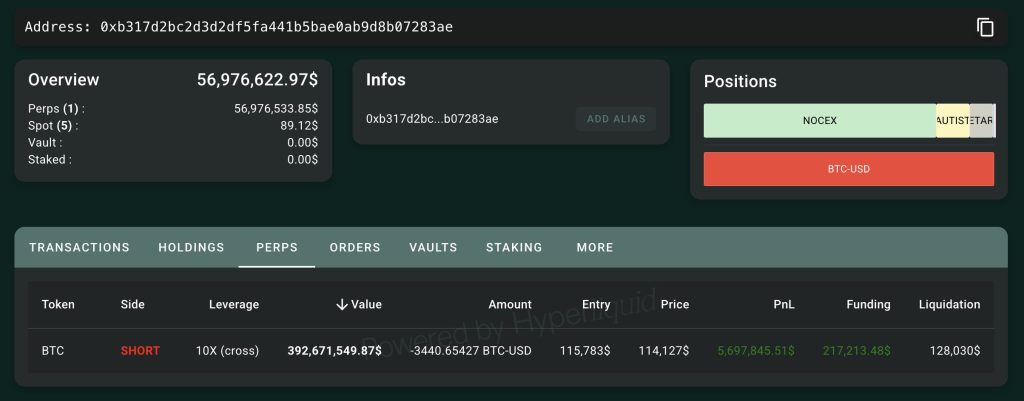
A legendary Bitcoin OG whale, known for perfectly shorting Bitcoin and Ethereum before the recent market crash, has once again entered the market and is again shortening Bitcoin with a massive 3,440 BTC ($392 million) short at a 10x leverage.
Now, the re-entry of this whale has raised eyebrows. Many in the crypto space are worrying is another crypto crash is coming, or just a daring bet riding on market fear?
BitcoinOG whale Shorting BTC Again
According to on-chain data, this Bitcoin OG whale has opened a massive short position on Bitcoin at an average price of around $115,783 per BTC, with a liquidation level near $128,000 on Hyperliquid, a high-risk trading platform.
Analysts point out that 10x leverage means even minor drops could lead to eye-popping gains, but a price rebound could clear out millions.
Interestingly, the whale’s short comes right after he profited $192 million shorting the previous crash triggered by Trump’s surprise China tariff.
Placing another massive short so soon has raised eyebrows across the crypto community. Many see it as a warning signal, especially since the trade appeared just as Bitcoin slipped to $112,700, reflecting a drop of 2%.
On-Chain Indicators of Market Stress
Several key factors from macroeconomic, technical, and on-chain are fueling fears that another sharp correction could be imminent.
- Large Bitcoin transfers to exchanges spiked above $2 billion, a common sign of selling pressure.
- Data from Derive.xyz showed heavy “put” buying from traders in bitcoin and ether, with CME futures open interest hitting record highs near $39 billion.
- The Spent Output Profit Ratio (SOPR) for short-term holders fell below 1.0, indicating many are selling at losses, a sign of capitulation phases.
- Stablecoin outflows totaling $8 billion have drained buying power from exchanges, limiting liquidity for price support.
Community Divided Over Whale’s Intentions
Crypto traders on X are split. Some believe this whale might have inside information, given the precision of previous trades. Others think it’s simply a high-stakes gambler who thrives on volatility.
As of now, Bitcoin is trading around $112765, reflecting a slight drop. However, technical analysis highlights $105,000 as strong short-term support for BTC, with $118,000–$124,000 seen as the next major resistance zones.
También te puede interesar

Spheron Network Joins Hivello for DePIN Supply Scaling

Salesforce Pledges $15B to Expand AI Ecosystem in San Francisco
