

On-chain data perspective: judging market tops through early holder behavior
Early adopters often control a significant portion of the token supply, and their buying and selling decisions are crucial to market trends. Understanding the behavioral patterns of early adopters can provide traders with crucial insights into market trends and potential price pullbacks/tops.
This article is translated from "Tracking Early Token Holder Behavior" by Antonio Manrique de Lara Martín by Pao Ben Finance Web3.0 Study Room.
This article analyzes four indicators: "Early Holder Balance," "Herfindahl Index," "Net Unrealized Profit and Loss (NUPL)," and "Cost Basis Distribution Heatmap (CBD)" to help traders understand how to predict price tops and effectively manage risk.
Four major indicators
- Early Holder Balance
- Herfindahl Index
- Net Unrealized Profit/Loss (NUPL)
- Cost Basis Distribution Heatmap (CBD)
By examining the same phenomenon from multiple angles, it helps traders more accurately predict market turns and optimize exit timing.
1. Early Holder Balance
A direct way to assess the influence of early adopters is to track changes in their holdings. Early adopters typically accumulate tokens at low prices. As the asset appreciates, some holders begin to sell, increasing selling pressure and often triggering price corrections. Tracking the evolution of their holdings can reveal large-scale profit-taking trends and help predict pullbacks.
How it works
- Balance Dips: Early holders selling off their holdings will reduce their total holdings. If this coincides with a price peak, it can signal significant selling pressure and could signal a top.
- Price Impact: Due to the control of a large amount of supply, selling by early holders can cause a sharp drop in price.
- Chart Insights: Monitoring balance changes can identify large-scale profit-taking trends and help predict market pullbacks.
Figure 1↓ shows how early SHIB holders accumulated tokens at low prices (accounting for over 20% of the total supply) and sold them in large quantities after the price soared, causing the price to plummet.
The blue line in the figure represents SHIB holdings, and the yellow line shows the percentage of total supply held by early holders, clearly showing the evolution of their relative holdings and the market impact of selling activities.
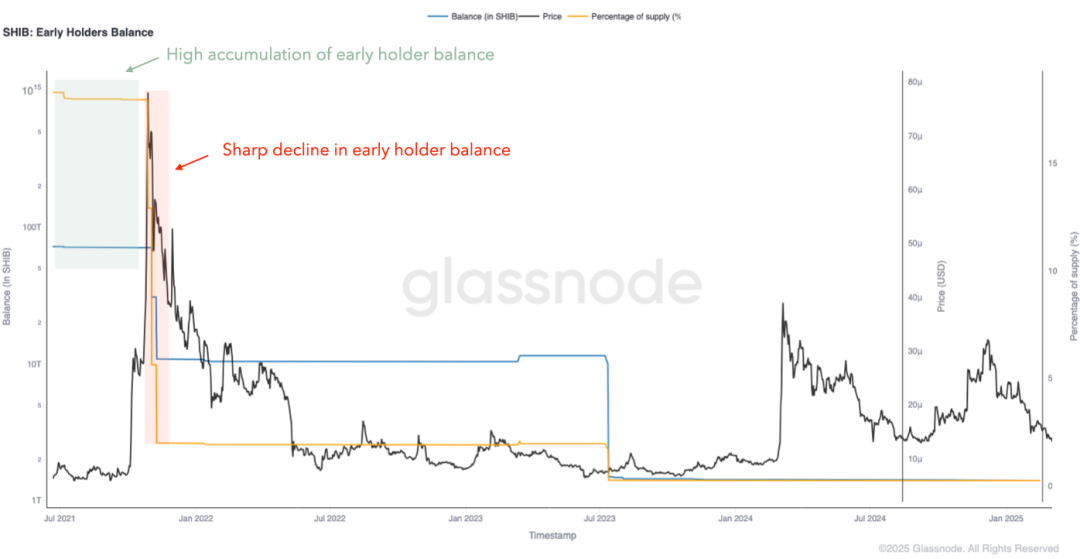
Figure 1. Balance of SHIB early holders
To maintain consistency within the analysis of the same asset, the following metrics in this article will focus on SHIB. However, before diving into further analysis, it is valuable to compare the balances of early holders of different tokens to observe differences in their behavior and potential impact on price.
Figure 2↓ shows the strategic selling of APW early holders at key price peaks:
- First sell-off (left): The yellow line representing the proportion of holdings by early holders drops sharply, indicating a large-scale sell-off near the first price peak.
- Accumulation phase (pictured): After the initial sell-off, activity among remaining early holders is low.
- Second sell-off (right): When the price rises again, early holders sell off a large amount of their holdings again after increasing their holdings, causing their share of the supply to drop sharply.
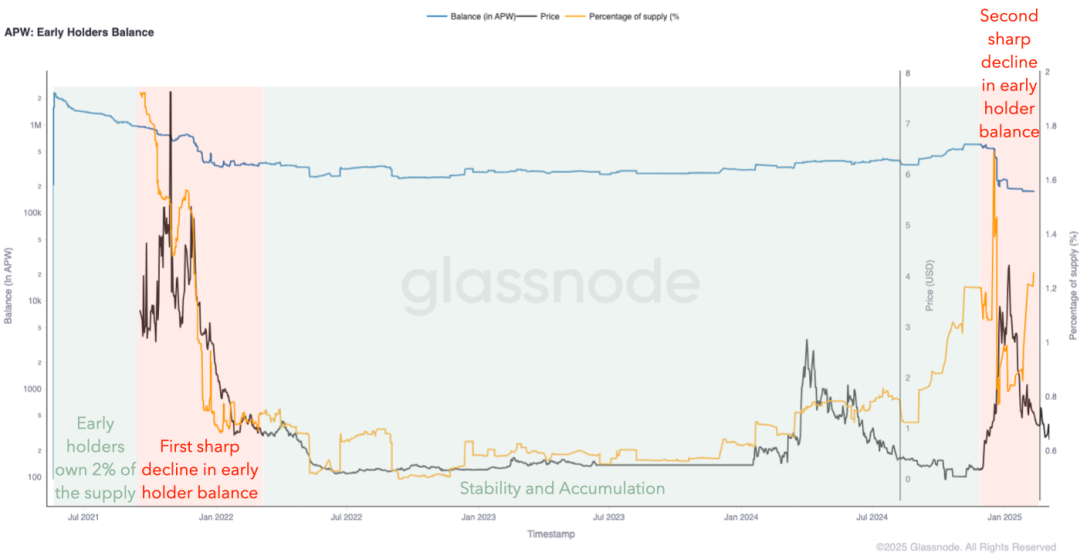
Figure 2. Balance of early APW holders
Figure 3↓ shows that the holdings of TSUKA's early holders are gradually decreasing, which is different from the previous sudden sell-offs:
- A steady decline in holdings prevents sharp price drops.
- More controlled selling leads to better price stability.
- The selling pressure is dispersed and released to reduce market impact.
This shows that it adopted an orderly exit strategy, effectively curbing extreme volatility.
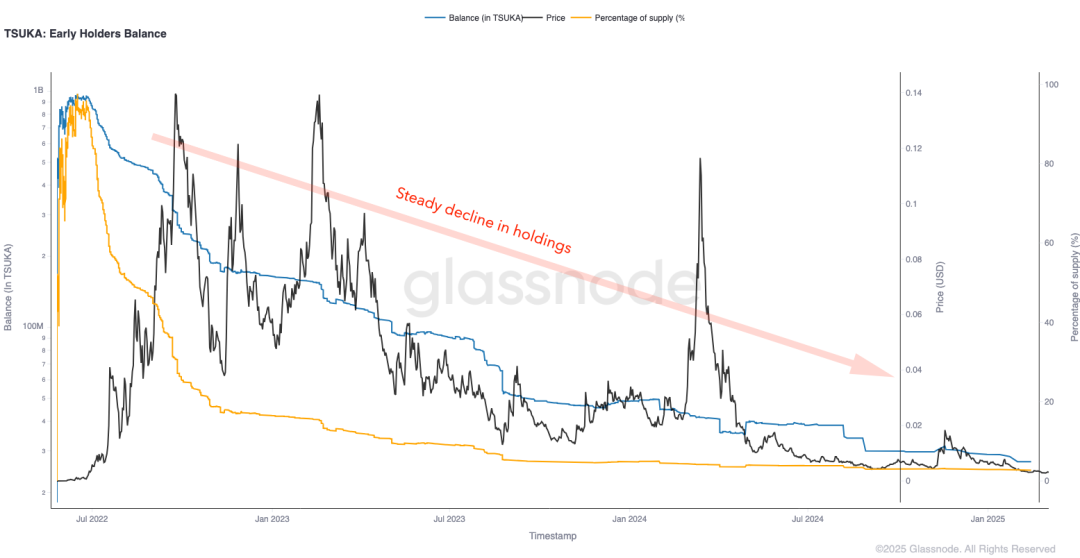
Figure 3. Balance of early TSUKA holders
In Figure 4↓, early PEPE holders sold most of their tokens after the first price increase (the orange line on the left drops sharply):
- Early exit: Most tokens are sold in the early stages, which causes a sharp drop in price but also avoids subsequent large-scale selling pressure (similar to the SHIB model).
- Price discovery: After early holders leave, the market is able to price more organically.
- Long-term stability: Without subsequent large-scale distribution, price movements are driven more by new demand than by large investors. This model avoids incremental selling pressure, allowing the market to form fair prices without sustained supply shocks.
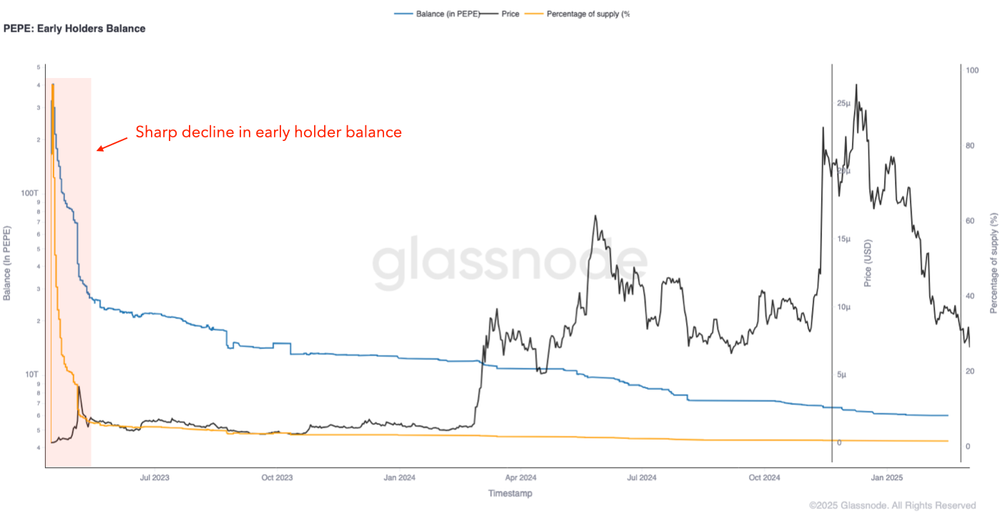
Figure 4. Balance of PEPE early holders
2. Monitor the Herfindahl Index
The Herfindahl Index measures market concentration. A high index indicates that a small number of large investors dominate the market, while a low index reflects a more dispersed distribution of tokens.
How it works
- Influence of early holders: In the early stages of token issuance, early holders tend to highly concentrate supply, pushing up the Herfindahl index.
- Market dynamics: As it sells off, the index falls, reflecting that the token distribution is becoming wider.
- Market Signal: The Herfindahl Index declines in tandem with the balance of early holders, indicating that tokens are being dispersed among more market participants, suggesting potential profit-taking and a possible market top.
Figure 5↓ shows the SHIB Herfindahl Index (red line) and price (black line). The sharp drop in the index corresponds to the moment when large investors sell off their holdings, which coincides with the price peak.
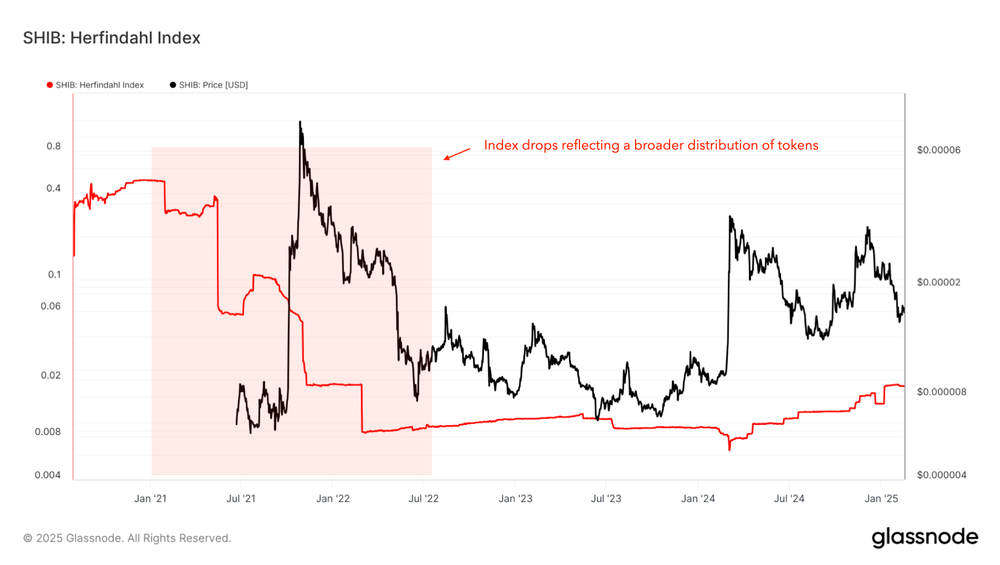
Figure 5. SHIB Herfindahl Index
3. Using Net Unrealized Profit and Loss (NUPL)
Net Unrealized Profit and Loss (NUPL) is an on-chain metric that quantifies the unrealized gains and losses of all token holders at a specific point in time. It serves as a sentiment indicator, detecting potential market tops and bottoms based on investor profit and loss dynamics.
For early holders, profit-taking behavior is often reflected in early peaks of NUPL - because they tend to accumulate at low prices and sell during periods of strong price increases.
How it works
- Early NUPL rises → Market frenzy and sell-off: High NUPL values early in a token’s lifecycle indicate that most holders are profitable, often triggering profit-taking by early holders and increasing selling pressure.
- Early NUPL decline → Large investors exit the market: If the token reaches a new high but NUPL begins to decline in the early stages, it indicates that early adopters and large investors are selling, leading to a weaker market structure.
Figure 6↓ shows SHIB's NUPL alongside its price, showing that early high NUPL values coincide with price peaks, often followed by sell-offs. Pay special attention to the first price peak (corresponding to the peak of early holder activity, consistent with the balance indicator).
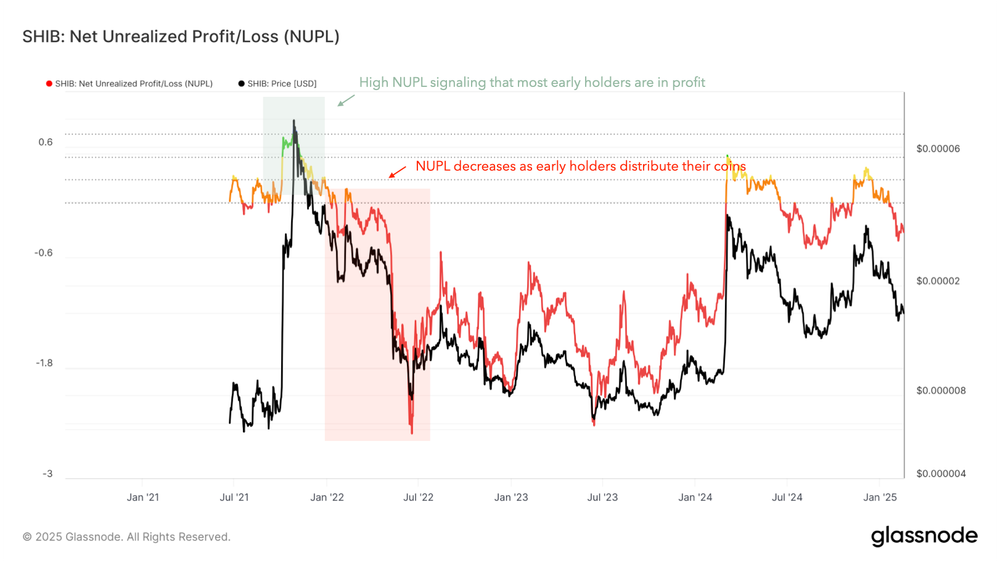
Figure 6. SHIB's Unrealized Net Profit and Loss (NUPL)
4. Analyzing Cost Basis Distribution (CBD)
The CBD heatmap visualizes the evolution of the token acquisition cost (cost basis) over time. Focusing on the early stages of the chart identifies the cost basis ranges of early holders, providing insights into their initial accumulation zones and the evolution of their selling behavior.
How to Read a CBD Heat Map
- Each interval on the vertical axis represents a specific cost basis level, and the color depth reflects the accumulated supply at that average entry price (blue = low concentration, red = high concentration).
- The black line represents the current price.
- The area below the black line is profitable (cost basis is lower than the current price).
- The area above the black line is in a loss-making state (cost basis is above the current price). This visualization helps track the evolution of accumulation areas and whether supply is being sold off over time.
How it works
- Low-cost base: Early holders accumulate tokens at extremely low prices, forming a low-cost base cluster (such as the red area in the January 2021 chart).
- Accumulation vs. Selling: As prices rise, holders start selling, causing the low-cost range to thin out (the red area in the figure shifts to blue, indicating that the accumulated supply at low prices is being sold).
- Top identification: If the heat map shows that a large number of low-cost holdings are sold near the price peak, it may indicate that the market has reached a top.
- Predicting a sell-off: CBD heat maps not only reveal early holders' selling behavior but also predict their propensity to sell—by visualizing their cost basis, revealing the price level at which they accumulated tokens. Comparing the current price to these accumulation zones can assess the strength of their motivation to take profits. If the price is significantly above the accumulation zone, the probability of early holders selling increases, making heat maps a powerful tool for predicting potential sell-offs.
Figure 7↓The heat map shows that early SHIB holders accumulated in the low price zone in January 2021 (red and yellow range), and sold off on a large scale near the market peak in October-November 2021, which is manifested by a sharp price increase, fading of the early accumulation band and subsequent decline.
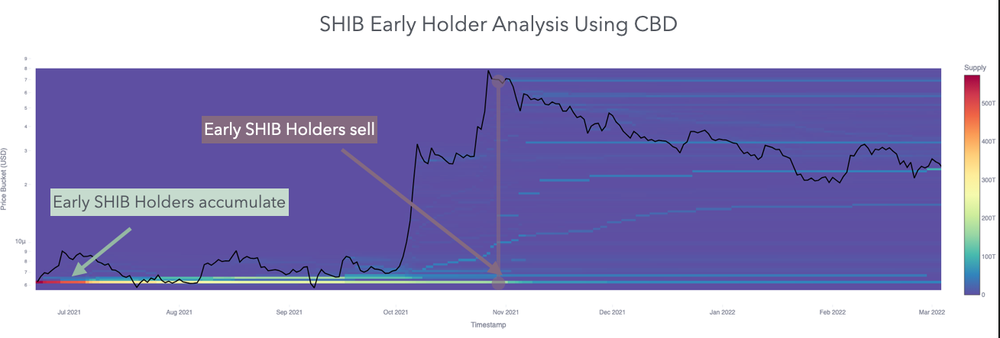
Figure 7. SHIB's early cost base distribution
5. Conclusion: Framework Value and Application Strategy
The comprehensive application of four methods can comprehensively analyze the behavior of early holders and assist traders in predicting potential market tops:
- Early Holder Balance Analysis: Reveals when early investors reduce their holdings (often before prices fall).
- Herfindahl Index: Tracks changes in market concentration and identifies the exit of large players or the diversification of ownership.
- Unrealized Net Profit and Loss (NUPL): Assess market sentiment. A high NUPL value indicates that early holders have not realized significant profits, increasing the probability of sell-offs.
- Cost Basis Distribution (CBD) Heat Map: Pinpoints where early investors took profits (potentially signaling the end of a bull market).
These four indicators complement each other, providing insights into early adopter behavior from different perspectives. When multiple indicators generate synergistic signals, predictive power is significantly enhanced, reducing uncertainty and optimizing decision-making.
By integrating these insights, traders can optimize their strategies and better navigate the early market stages of tokens.
También te puede interesar

A panoramic interpretation of the current status of DeFi development: Aave and Lido become the highest TVL protocols, and Solana ranks second among the public chains

"Bazaar" surpasses "Cathedral", how does cryptocurrency become the cornerstone of trust in the AI agent economy?
