-
Hyperliquid is recovering from its recent correction as renewed buying interest, resilient market structure, and improving sentiment restore bullish momentum.
-
The liquidation map shows heavy short positions above current prices, increasing the likelihood of a short squeeze that could drive a 40% rally.
The Hyperliquid price is recovering after a sharp correction that followed a major token unlock and whale-driven profit-taking. After the recent correction that dragged the levels to $55, the buyers stepped in, viewing it as a buying opportunity. Moreover, the rounds of Arthur Hayes selling all of his HYPE positions had triggered a massive pullback, while his buying has flipped the market sentiment.
The latest recovery is particularly noteworthy because it coincides with a bullish technical structure and a liquidation map showing significant short positions above the current price. If those levels are breached, forced liquidations could accelerate the rally and potentially push HYPE another 40%.
What Does the Hyperliquid Price Chart Suggest?
Hyperliquid (HYPE) continues to trade within a well-defined ascending channel, indicating that the broader uptrend remains intact. Rather than breaking market structure, the latest correction appears to be a retest of support within the channel, a pattern often seen during healthy bullish trends. The price has already bounced from the lower half of the channel and is attempting to reclaim momentum near the midline.
As long as HYPE continues to respect this structure, buyers are likely to maintain control of the broader trend.
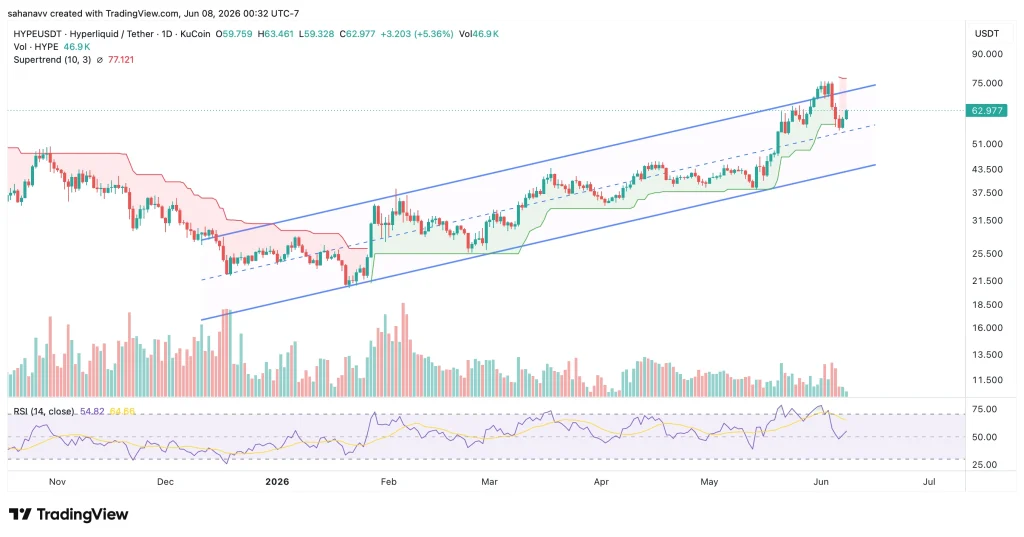
Another encouraging signal comes from the RSI, which has cooled to around the neutral zone after previously approaching overbought conditions. This reset suggests that excessive bullish momentum has eased, potentially providing room for another upward move if buying pressure returns. Besides, the Supertrend has a bearish trend, which raises concerns over the next price action.
From a technical perspective, the immediate resistance lies in the $70-$75 region, where HYPE recently faced selling pressure. A decisive breakout above this zone would confirm renewed bullish momentum. On the downside, the $58-$60 range has emerged as an important support area. Holding above this level would keep the ascending channel intact, while a sustained break below it could shift sentiment toward a deeper correction before the next directional move.
What Does the Hyperliquid Liquidation Map Indicate?
Beyond the price chart, the Hyperliquid liquidation map provides valuable insight into where the market could move next. At the current price of around $63, the data shows a significant imbalance between long and short liquidation clusters, with considerably larger liquidity sitting above the market than below it.
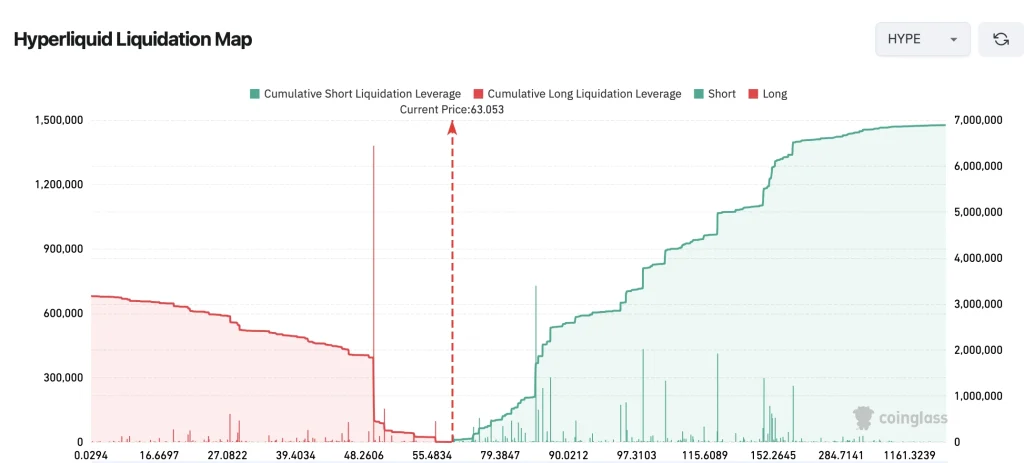
The chart displays a concentration of short liquidation leverage beginning above the current trading range and increasing sharply toward the $80, $90, $100, and even $115 levels. These areas represent price zones where short sellers could be forced to close their positions if HYPE continues moving higher, called the Short squeeze.
On the downside, the liquidation map shows comparatively limited long liquidation leverage below the current price, suggesting the immediate downside pressure may be less aggressive than the upside liquidation potential.
Can Hyperliquid Rally Another 40%? Here’s What Needs to Happen
Hyperliquid’s bullish structure remains intact, but a 40% rally will depend on its ability to reclaim key resistance and sustain buying momentum. The token continues to trade within an ascending channel, suggesting the broader uptrend has not been invalidated.
A decisive breakout above the $70-$75 zone could trigger fresh buying interest. More importantly, the liquidation map shows significant short positions stacked above the current price, meaning a move higher could force short sellers to cover their positions and accelerate the rally toward the $88-$90 region.
However, the bullish outlook would weaken if HYPE loses the $58-$60 support area, which could shift momentum toward a deeper correction before the next breakout attempt.