-
After a fine upswing, Stellar's price rally is cooling as it heads back to $0.20 with over 2.5% drop in the past 24 hours
-
The short-term price action hints toward a drop below the range, while the long-term prospects remain in favour of bulls
Stellar (XLM) price is approaching a decisive moment as the price hovers near the $0.20 level, a zone that has repeatedly acted as both support and resistance in recent months. After a sharp rally toward $0.26, the crypto has entered a corrective phase. This raises questions about whether the pullback is merely a pause in the uptrend or the start of a larger bearish move.
While the 1-hour chart points to growing downside pressure and a continuation of the recent decline, the daily chart suggests that XLM is still holding above a critical support area that could keep the broader recovery intact. With bulls and bears battling for control around $0.20, Stellar appears to be at a crossroads heading into the week ahead.
Why Is the $0.20 Level So Important for Stellar (XLM)?
The daily chart of Stellar suggests the price remains under short-term selling pressure as it is consolidating around a newly formed support range. After the rejection from $0.3, the bearish forces dragged the levels below the interim support range around $0.22. This further triggered an extended bearish action towards $0.20, the newly formed support range. The technicals have also turned cautious, hence raising the possibility of a healthy correction.
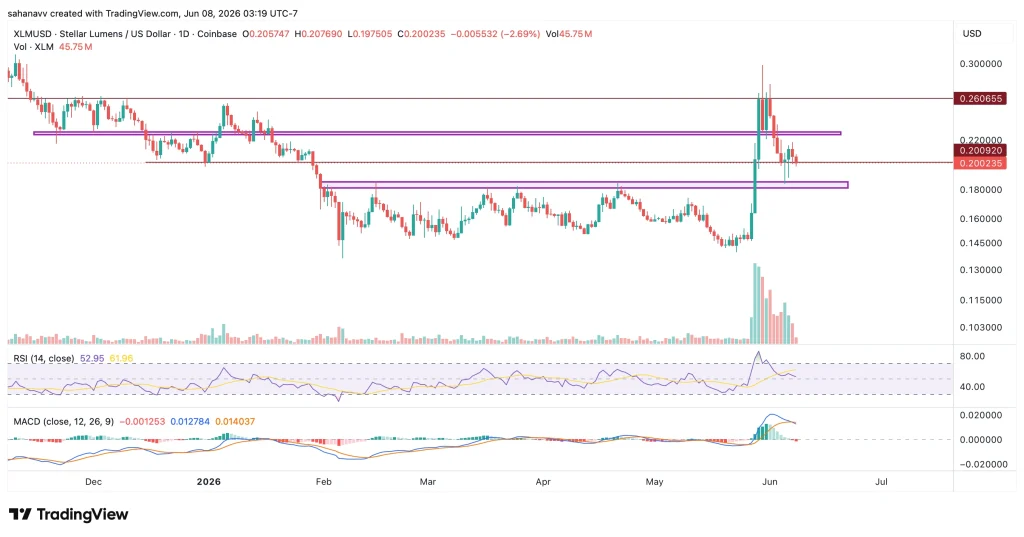
The RSI has cooled to around the neutral 50 region after previously reaching overbought territory. Similarly, the MACD remains above its longer-term baseline despite showing signs of slowing momentum, suggesting that the recent decline is a loss of momentum rather than a confirmed bearish reversal.
From a structural perspective, bulls need to defend the $0.18-$0.19 support zone and reclaim the $0.22 resistance area to restore bullish momentum. A successful breakout above this level could reopen the path toward the recent high near $0.26. Conversely, a sustained break below $0.18 would weaken the daily structure and increase the probability of a deeper correction.
What’s Next for Stellar (XLM) Price Rally?
The area around $0.20 is currently the most important level to watch this week. If the XLM price fails to defend this range, the traders can expect a short-term pullback below $0.20, which appears likely. However, the bulls appear to be vigilant enough and hence, a rebound may be triggered back above the range.