-
Ethereum is testing a multi-year support zone near $1,650 as bulls attempt to prevent a deeper correction after a 45% decline.
-
A sharp drop in Open Interest suggests a leverage reset, while $2.5 billion in short liquidity above current levels raises the odds of a short squeeze.
-
If ETH reclaims $1,700, liquidation clusters near $1,750 and $1,800 could fuel a stronger recovery rally in the coming sessions.
Ethereum (ETH) price remains under pressure, trading near $1,685 after extending its recent downtrend and losing nearly 45% from its highs above $3,000. The latest decline has pushed the token toward a crucial long-term support zone around $1500, raising concerns over whether bulls can prevent a deeper correction.
However, derivatives data suggest the market may be approaching a turning point. While Open Interest has dropped sharply, indicating a leverage reset, the liquidation map shows billions in short liquidity above current levels. This setup increases the possibility of a short squeeze if the ETH price manages to reclaim key resistance levels.
The question arises: Will the ETH price reclaim $1800 or drop to $1200?
Ethereum Tests a Multi-Year Support Zone
Ethereum price is currently trading near a crucial support region that has repeatedly attracted buyers since the 2022 market bottom. The weekly chart shows ETH hovering around the ascending trendline that has guided the broader recovery over the past few years, making the current price action particularly important for the long-term trend.
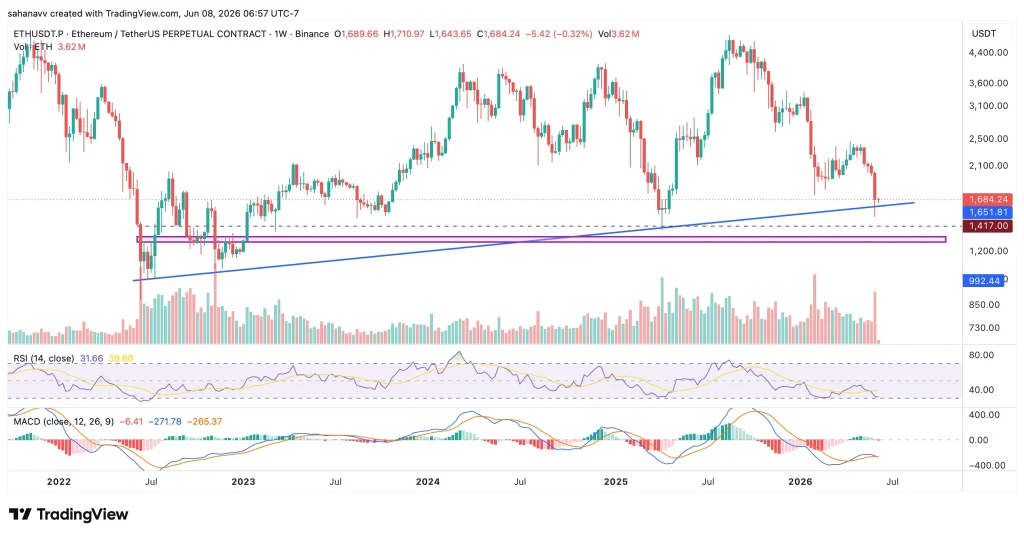
The weekly RSI has slipped close to oversold territory, reflecting weakening buying strength, while the MACD remains in a bearish crossover, suggesting sellers still hold the upper hand. For bulls, holding the $1,650-$1,400 support zone is critical to preserving the broader market structure. A successful defense could trigger a relief rally and allow ETH to reclaim higher resistance levels. Conversely, a breakdown below this range would invalidate the long-term support trendline and increase the risk of a deeper correction.
What Does Ethereum’s Open Interest Reveal?
Ethereum’s Open Interest has declined sharply from nearly $35 billion to around $24 billion, signaling a significant reduction in leveraged positions across the market. Unlike aggressive bearish phases where Open Interest rises alongside falling prices, the current decline suggests traders are closing positions and reducing risk exposure.
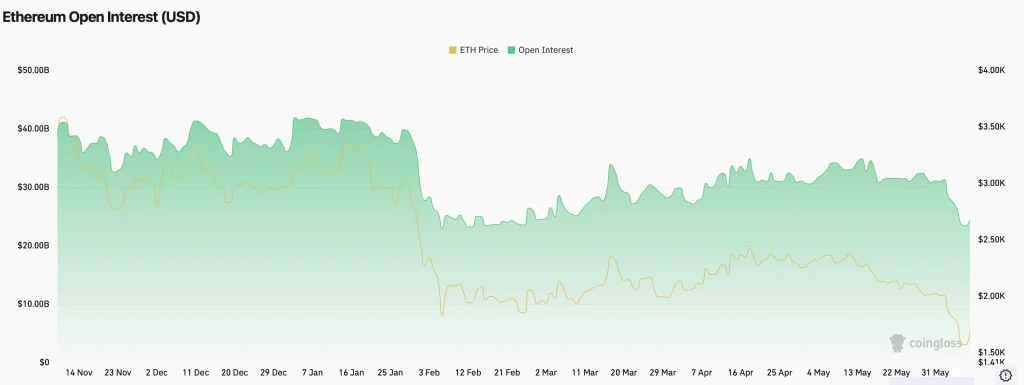
For Ethereum, the decline in Open Interest indicates that much of the speculative excess has already been washed out. If buyers begin returning near the current support zone, the reduced leverage environment could support a more sustainable recovery. However, continued weakness in both price and Open Interest would signal fading market confidence and increase the risk of further downside pressure.
Ethereum Liquidation Map Hints at a Potential Short Squeeze
While the weekly chart highlights a crucial support zone and Open Interest points to a leverage reset, Ethereum’s liquidation map reveals where the next major price move could be headed. The data shows a significantly larger concentration of short liquidation liquidity above the current price than long liquidation liquidity below it.
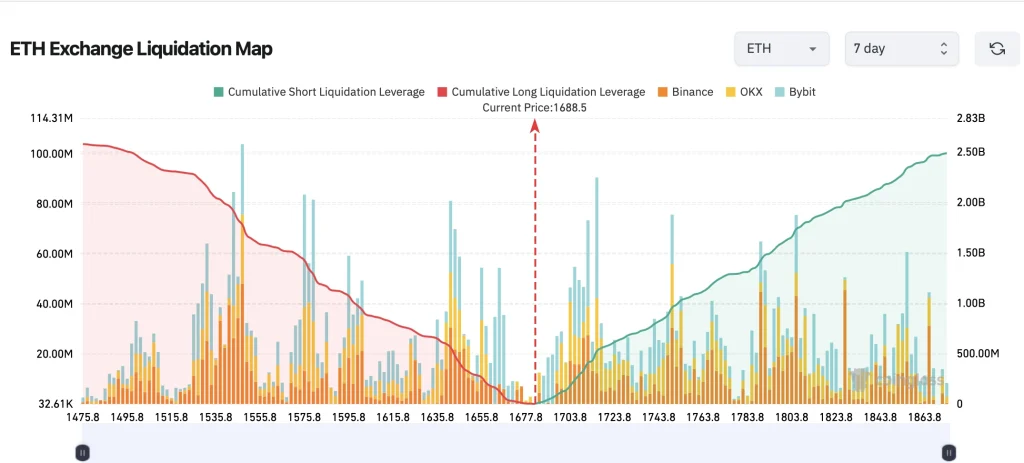
The largest liquidity clusters are located around $1,750, $1,800, and $1,900, suggesting that a large number of traders are currently positioned for further downside. If ETH manages to reclaim the $1,700 level, these short positions could begin getting liquidated, forcing traders to buy back their positions and adding momentum to the rally.
This imbalance in market positioning creates the conditions for a potential short squeeze, making the $1,700-$1,750region one of the most important areas to watch in the coming sessions.
Can Ethereum Rally Toward $1,800?
Ethereum’s short-term outlook now depends on whether bulls can successfully defend the current support zone and reclaim key resistance levels. The combination of a leverage reset, oversold momentum conditions, and significant short liquidity above the market creates a favorable setup for a recovery attempt.
The bullish case strengthens if ETH reclaims the $1,700 level and sustains momentum above it. Such a move could trigger a wave of short liquidations, accelerating buying pressure toward the $1,750 and $1,800 zones. Failure to hold the $1,650 support region could weaken the broader structure and shift focus toward the lower support zone near $1,400.
For now, Ethereum sits at a crucial turning point where both technical and derivatives indicators suggest that the next major move could be decisive for the weeks ahead.