

Solana (SOL) Price: Is $60 the Bottom? Analysts Flag a Historic Accumulation Zone
TLDR
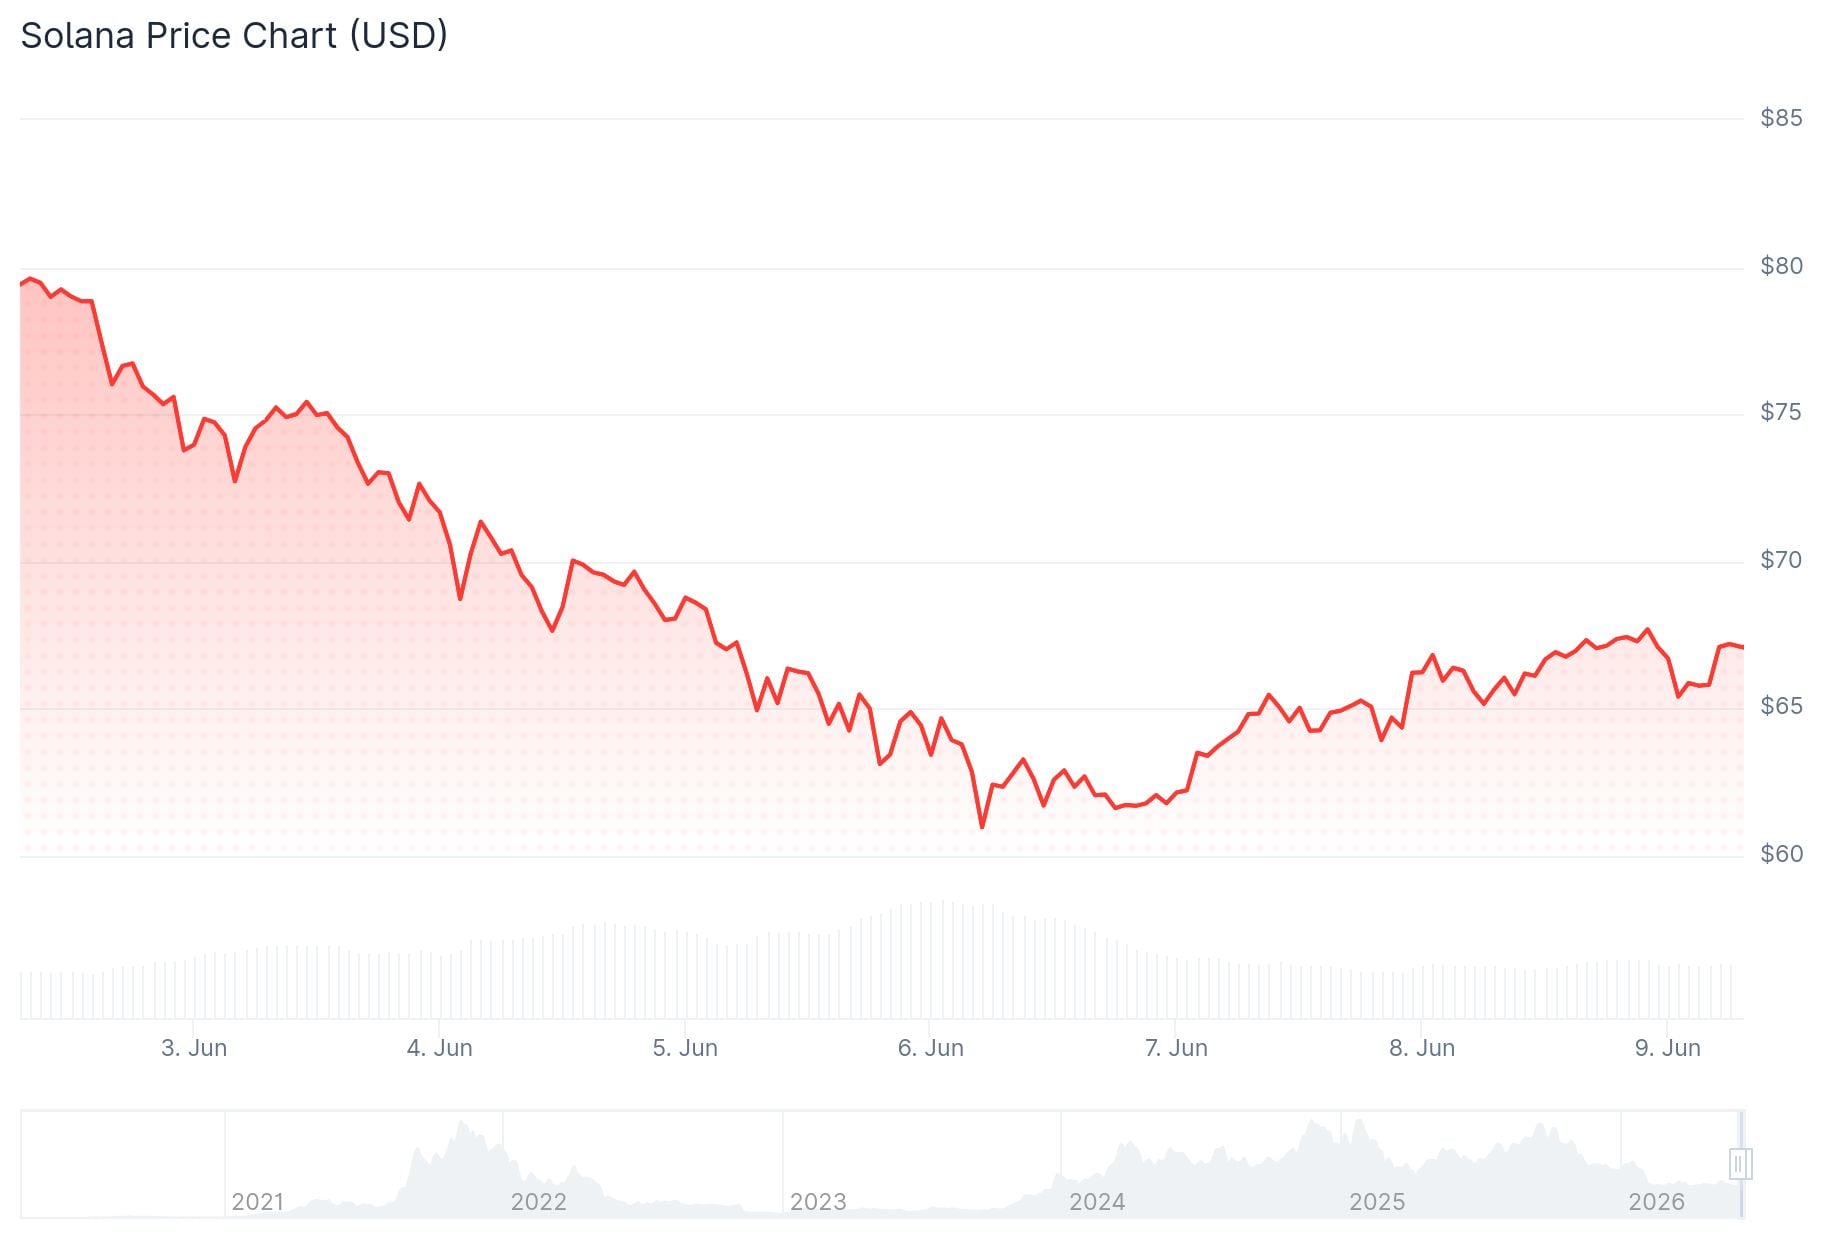
- SOL rebounded from $60 to around $64.85, up over 5% in 24 hours
- Eight consecutive red monthly candles mark the worst streak in Solana’s history
- Monthly RSI is more oversold than during the 2022 FTX crash
- Key resistance sits at $70–$76; failure there could send SOL back to $55–$58
- Institutions are increasingly choosing Solana for DeFi, stablecoins, and RWA infrastructure
Solana is trading around $64.85 after bouncing from the $60 region. The move represents a 5% gain in 24 hours, offering short-term relief after a prolonged sell-off.
 Solana (SOL) Price
The $60 level is now the first major psychological support. If buyers hold this area, SOL could push toward $70 and then $76. If not, the next downside target sits between $55 and $58.
The bigger picture shows how extreme this sell-off has become. SOL has printed eight straight red monthly candles, a first in its history. It is also down more than 80% from its all-time high.
The monthly RSI is now more oversold than it was during the 2022 FTX collapse, when SOL fell to around $8. That level of oversold pressure does not guarantee a reversal, but it marks a historically stretched move to the downside.
Analysts Watch Key Levels
Analyst Crypto Tony flagged a retest risk. SOL broke down sharply before bouncing, and the concern is that price may revisit the broken support area before rejecting again, making the $70–$76 zone critical.
Trader Symba noted that the SOL/BTC pair is still near a major long-term support zone. If that pair holds, it could signal that Solana is close to forming a relative bottom. Symba’s longer-term view points to new highs above $300.
Analyst Rod is watching the $40–$50 range as a potential accumulation zone. If SOL builds a base there, Rod sees a possible recovery target near $175.
On the short-term chart, CryptoJack highlighted a breakout above a descending trendline on the 1-hour chart. SOL needs to hold above $62–$63 for this signal to carry weight.
Analyst Crypto Patel noted that the last time SOL traded in the 0.5–0.618 Fibonacci retracement zone, it rallied over 2,200%. Patel pointed out that Solana is once again trading in that same range, with the $40–$60 area flagged as an accumulation zone.
Institutions Still Backing Solana
Despite the price weakness, institutional interest in Solana is growing. Solstice CEO Ben Nadareski, whose protocol has secured over $500 million in funding, says Solana leads in developer activity, low transaction costs, and DeFi infrastructure.
Nadareski says the next wave of stablecoin growth will come from yield-bearing products and real-world asset tokenization, areas where Solana is building a strong foundation.
SOL is currently trading at $64.85 with $60 as the key support level to watch.
The post Solana (SOL) Price: Is $60 the Bottom? Analysts Flag a Historic Accumulation Zone appeared first on CoinCentral.


추천 콘텐츠

SEC Establishes Joint Financial Data Standards Under Transparency Act

cirBTC Goes Live as Circle Eyes WBTC’s 85% Share

Zcash Ironwood Upgrade Locks In Consensus Rules, Eyes Late July Activation


인기 뉴스
더보기
