

Solana Price Today Trades at $66 in Critical Market Phase with Bearish Indicators
The Solana price today is attracting attention as it trades around $66, facing significant pressure that reflects deeper market trends. Key indicators show that Solana’s technical outlook is in a critical state, combining price weakness with oversold conditions.
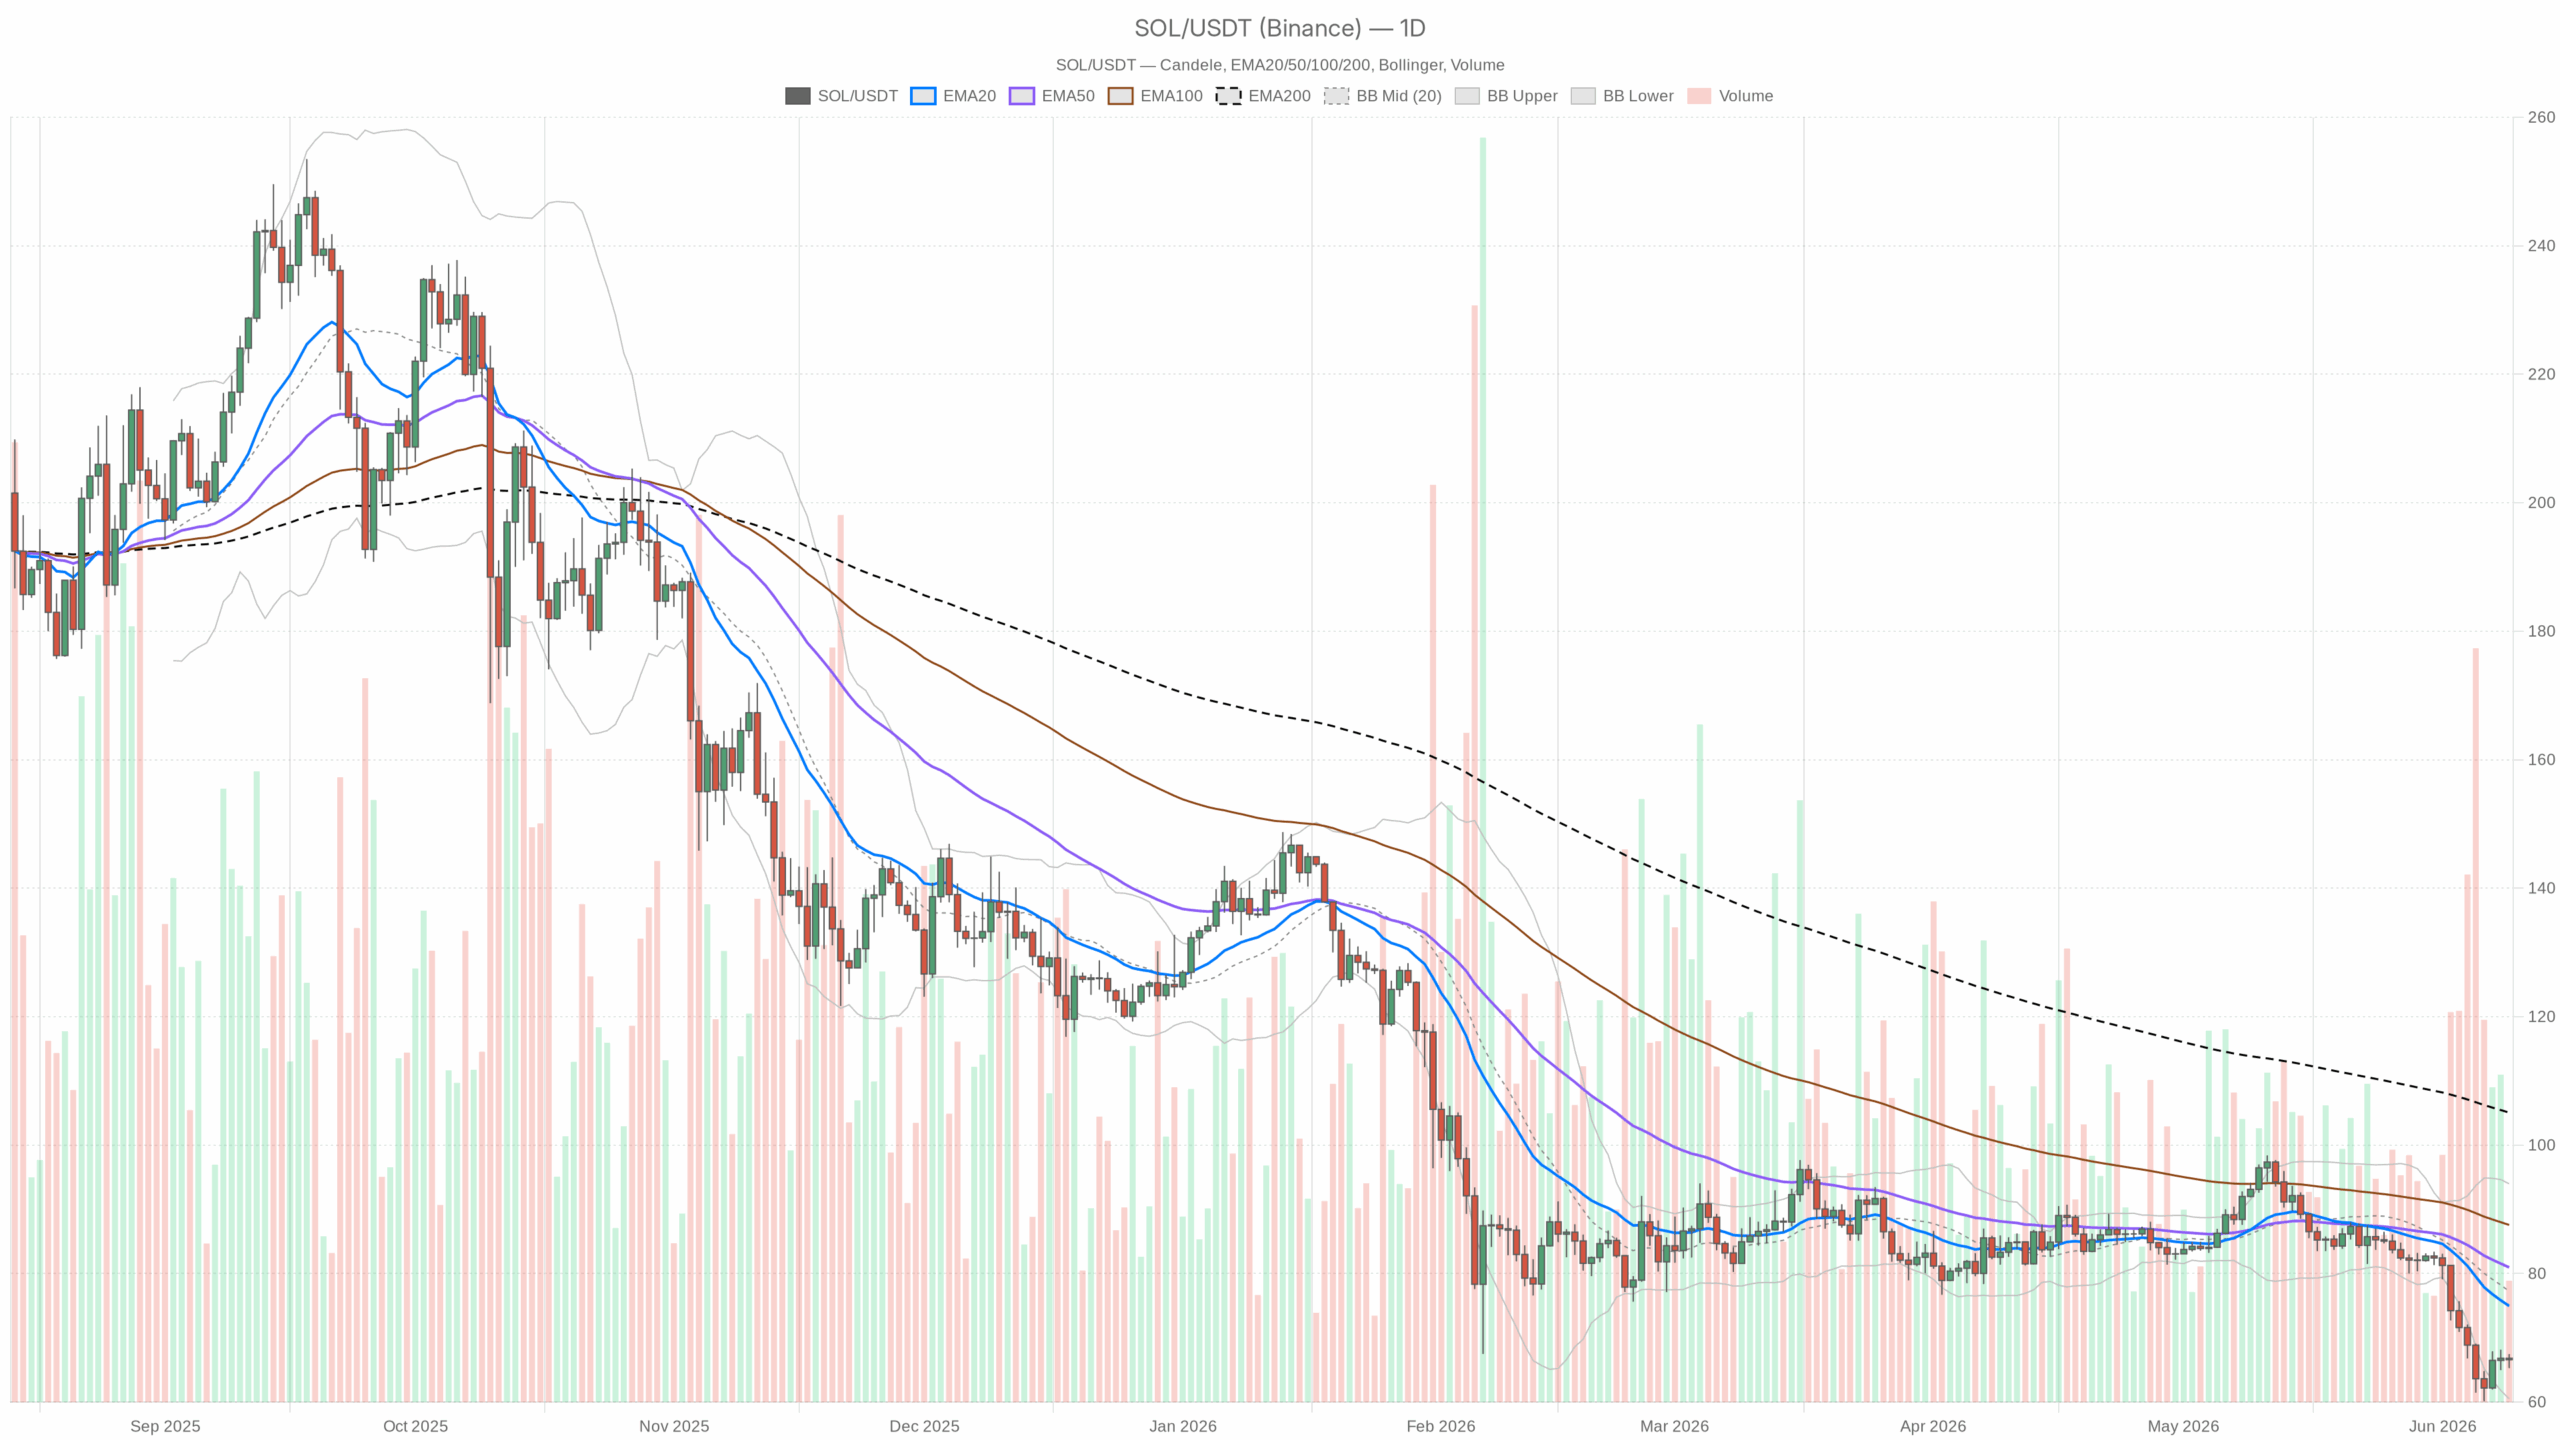 SOL/USDT — daily chart with candlesticks, EMA20/EMA50 and volume.
Solana Faces Bearish Momentum on the Daily Chart
Currently trading at $66.61, Solana is approximately 11% below its 20-day EMA and over 17% below the 50-day EMA. The 200-day EMA sits much higher at $105, highlighting the extent of the recent price depreciation. This is not a simple pullback during an uptrend; rather, it represents a systematic repricing downwards, with all major moving averages pointing downward. The overall daily trend is confirmed bearish and dominates the chart’s interpretation.
Adding context, the broader cryptocurrency market remains stagnant, with total market capitalization moving just 0.13% in 24 hours, while Bitcoin dominance holds firm at 56%. Concurrently, the Fear & Greed Index has dropped to an extreme fear level of 10. Though such sentiment does not guarantee an immediate reversal, it indicates that substantial panic is already factored into prices. The essential question is whether selling pressure on Solana is nearing exhaustion or if further declines are imminent.
Technical Indicators Show Conflicting Signals
The daily RSI at 28.42 confirms that Solana is well into oversold territory. Historically, such low RSI readings can precede either a sharp relief rally or a continuing decline, especially when overall market conditions are fragile. Alone, this oversold condition is not a buy signal because in sustained bear trends, RSI can remain low for extended periods. However, price is currently positioned just above the lower Bollinger Band floor of $60.52, suggesting increasing pressure for short-term mean reversion.
Meanwhile, the daily MACD presents a different picture. With the line at -5.63 and signal at -4.30, the widening negative histogram (-1.34) indicates accelerating downward momentum rather than a slowdown. This conflicts with the RSI signal, showing the sellers might not be done yet. This discord between indicators creates a critical tension to watch.
The Average True Range (ATR) of $4.17 suggests daily price swings around 6%, highlighting that volatility is high and trading entries at this level carry risk of noise-induced stop-outs.
Intraday Charts Reflect Short-Term Consolidation
On the 1-hour chart, Solana trades near its EMAs with price at $66.58 close to the 20-period EMA at $66.65 and above the 50 EMA at $66.13. The hourly RSI of 50.65 and a marginally negative MACD histogram imply a phase of consolidation rather than a definitive rebound. Price is contained between the hourly Bollinger Bands at $68.04 and $65.71, with immediate resistance near $67.62 and support levels around $66.33 and $65.44. To shift the hourly trend positively, reclaiming the 200 EMA at $69.51 is necessary.
On the 15-minute timeframe, Solana holds a slightly bearish stance with price below short EMAs and an RSI slightly below neutral. This reinforces that sellers maintain control over micro price action, though a very short-term floor remains near the 15-minute 200 EMA around $65.86.
Solana’s Ecosystem Shows Ongoing Activity Despite Price Weakness
The Solana network’s decentralized exchange (DEX) ecosystem continues to generate significant fee revenue, which contrasts the token’s price decline. Raydium’s daily fees surged by 33.6%, Meteora DLMM fees rose 24%, and Orca posted a remarkable 115% growth in 30-day fees. This on-chain activity suggests a persistent user and liquidity base even during adverse price conditions. Although this does not guarantee a price bottom at $66, it indicates the network’s fundamental strength is intact beyond current market volatility.
Potential Scenarios for Solana’s Price Movement
The bullish case depends on RSI-driven exhaustion leading to recovery. Maintaining support above $65.44 and climbing into the $67.62–$68 range on solid volume could set the stage for a base build. Breaking above the 20-day EMA at $74.97 would be a key sign of trend reversal. Conversely, a daily close below the lower Bollinger Band floor at $60.52 would confirm continuation of the downtrend.
The bearish scenario appears more consistent with current momentum. As long as the daily MACD histogram expands negatively and resistance near $67.62 holds, short-term rally attempts could fail. Lack of clear technical support below $60 raises concerns. This scenario would be invalidated by a clear daily close above $74.97 with improving momentum.
Investment Outlook and Strategy Considerations
The broader macro environment is unfavorable. Bitcoin dominance above 56% indicates rotation into safer assets while the Fear & Greed Index of 10 signals widespread anxiety. Solana at this price is not an attractive entry for trend-based buyers since the daily structure is broken and MACD confirms ongoing weakness. Conversely, buying merely based on oversold RSI without a stop loss entails risk of being caught in further decline.
Currently, Solana is at a decision point that calls for measured observation rather than action. Confirmation through a daily close above key pivots with improving momentum, or alternatively a sharp flush below $65 exhausting sellers, should guide future positioning. Prematurely chasing a bounce risks capital losses amid high volatility and uncertainty. The next 48 to 72 hours on the daily chart should provide essential clarity beyond what intraday signals can offer.
In summary, the Solana price today faces a complex interplay of oversold conditions and accelerating negative momentum, framed by a cautious market sentiment. Traders should watch for decisive daily closes that clarify whether the current phase marks the beginning of recovery or further capitulation.


추천 콘텐츠

Former Epstein assistant Lesley Groff appears before House panel

Stellar faces renewed selling pressure amid bearish derivatives data

How to Spot a South African Cyber-Scam Before You Click “Pay”


인기 뉴스
더보기
