

Alibaba Stock Slips Below Key Averages as Pentagon Blacklist Weighs

Alibaba stock faces mounting pressure as it trades at $120.07 on June 8, having broken decisively below critical moving averages. Regulatory headwinds from Washington have worsened an already bearish technical picture, pointing to continued downside risk for BABA shares.
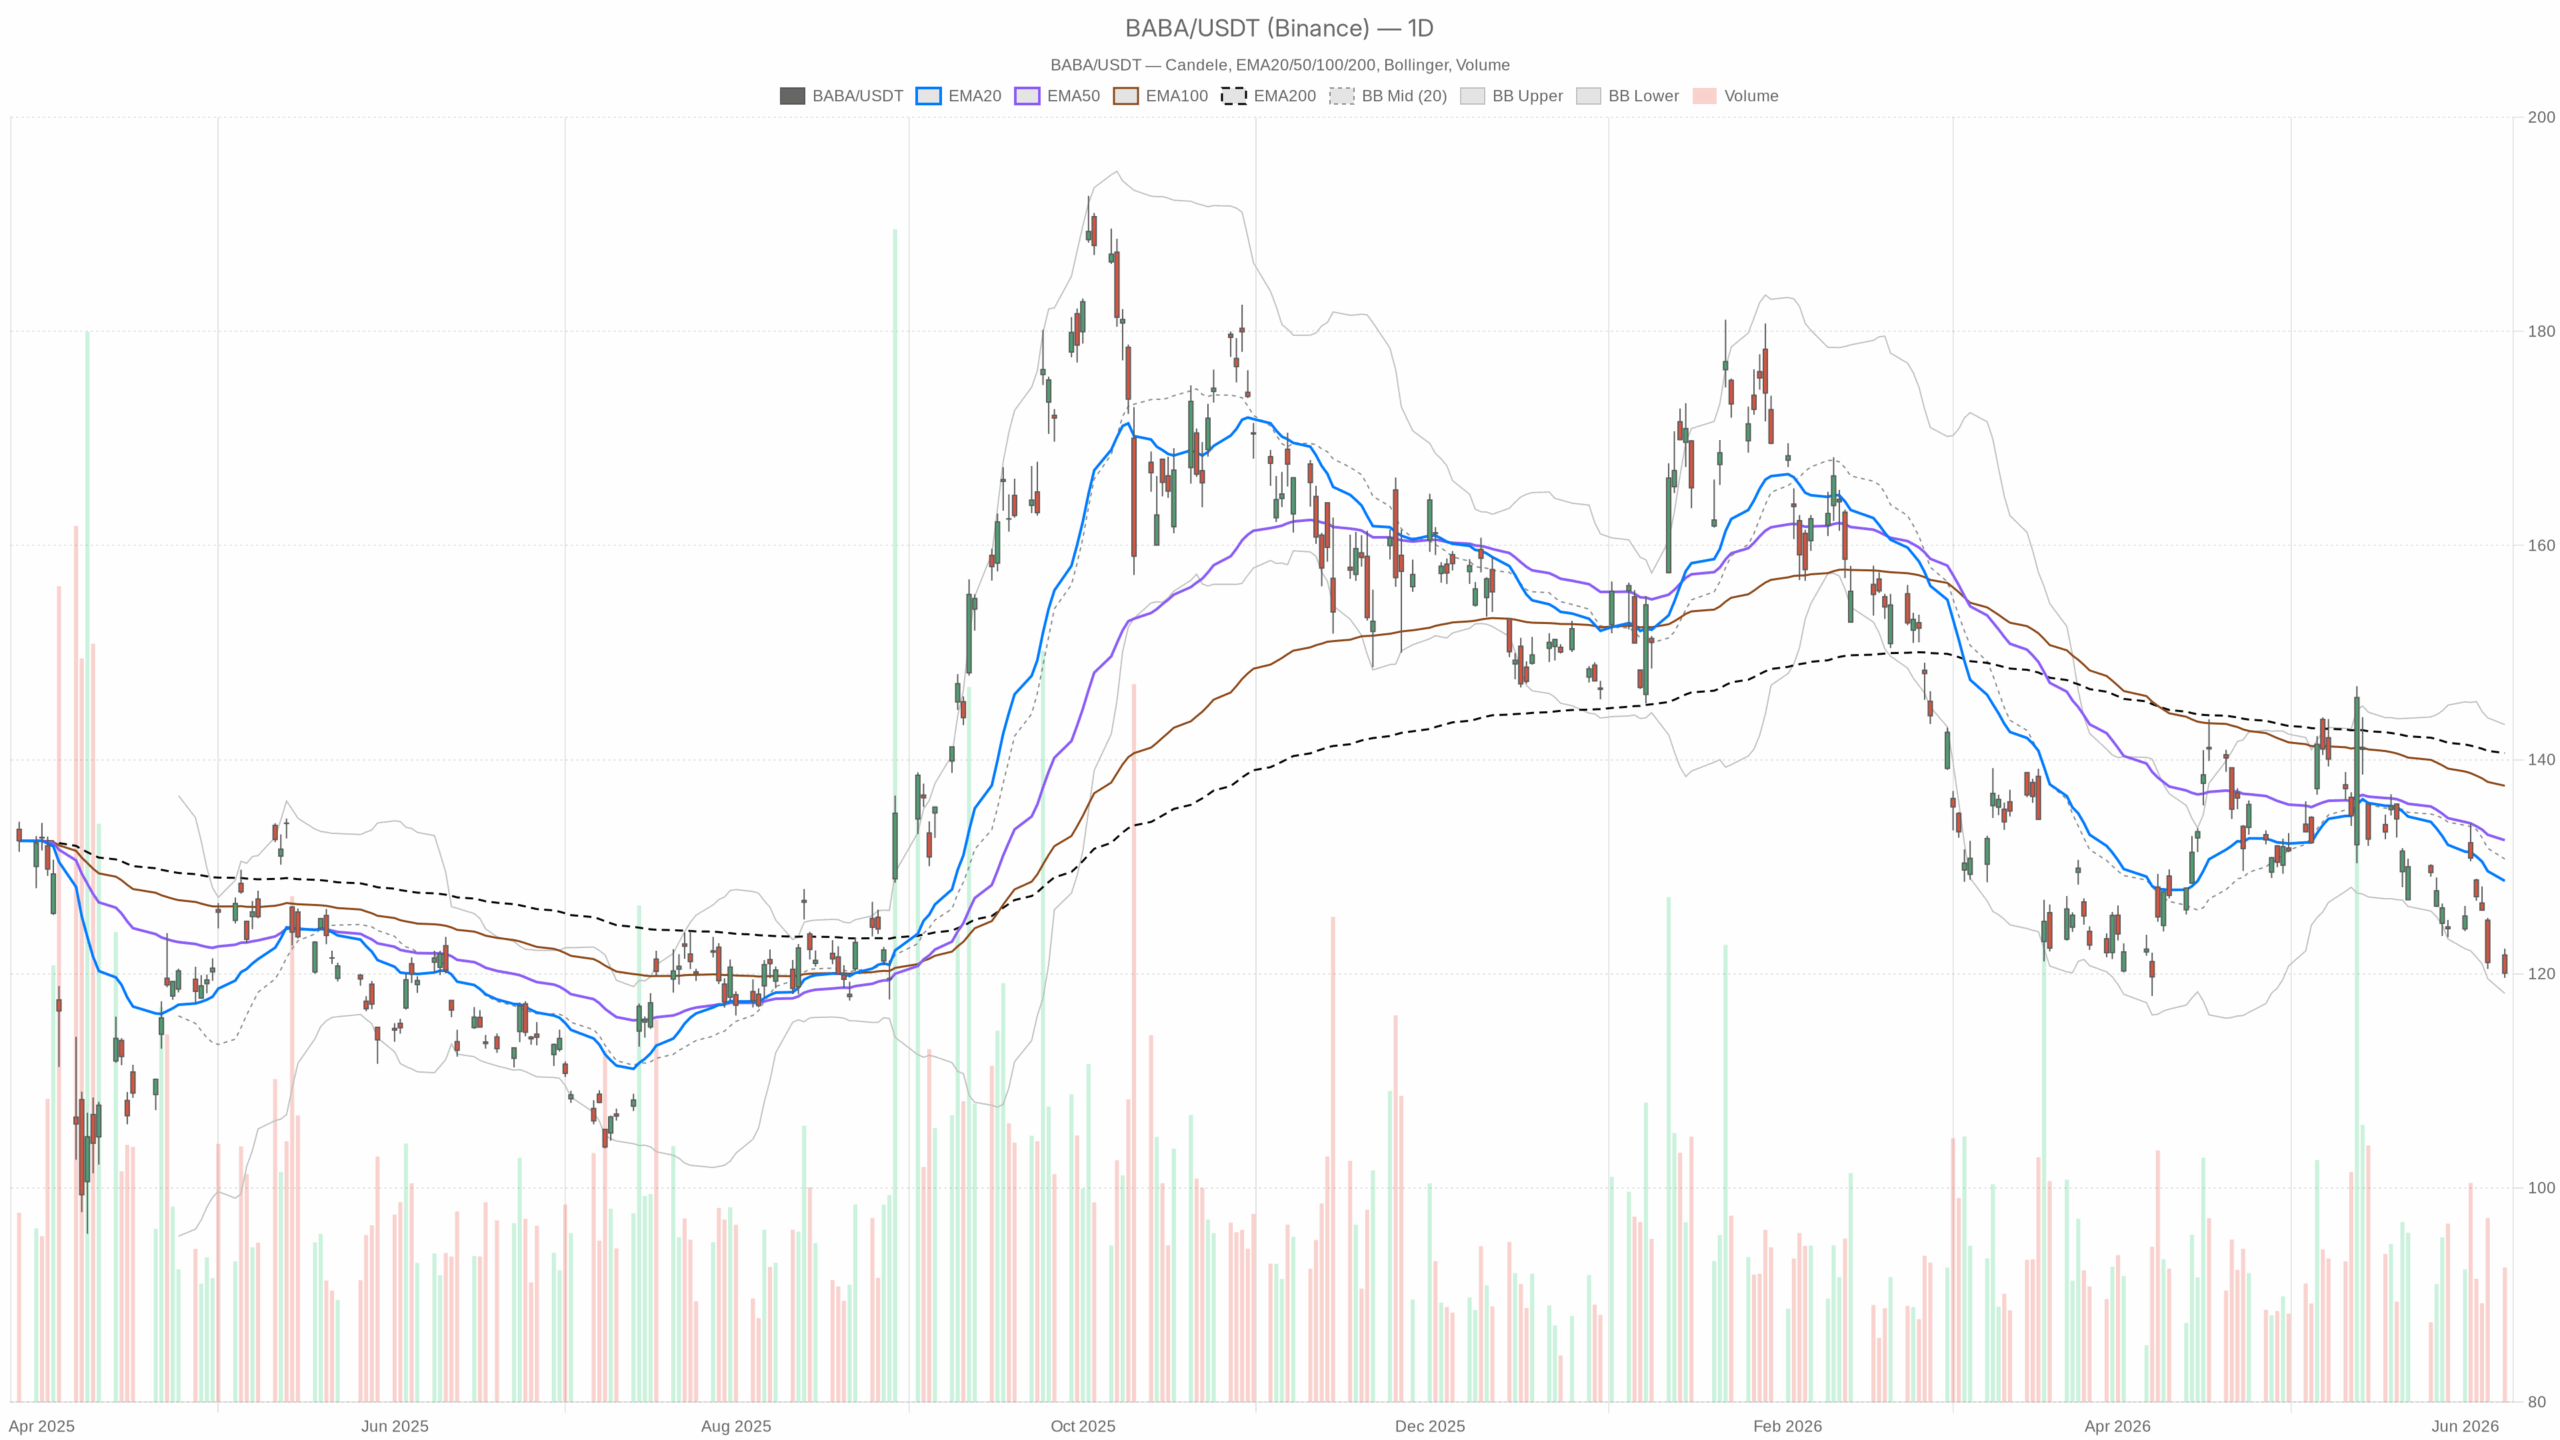 BABA — daily chart with candlesticks, EMA20/EMA50 and volume.
Alibaba Stock Daily Timeframe: Bearish Bias Dominates
On the daily chart, BABA is clearly in a downtrend, trading below its EMA20 at $128.68, EMA50 at $132.48, and EMA200 at $140.62. The price is anchored in the lower half of the Bollinger Band range ($118.17 to $143.29), with the midpoint at $130.73, which is significantly above current levels. This gap demonstrates how far the stock has diverged from its mean.
Momentum indicators reinforce this bearish stance. The MACD line stands at -3.05, below its signal line of -1.93, with a histogram at -1.12, indicating expanding negative momentum. The RSI at 36.19 nears oversold territory but does not yet suggest a reversal, a common feature in sustained downtrends especially amid adverse news. The daily ATR of $3.89 signals meaningful volatility, raising execution risks for short-term trades.
The daily pivot at $120.68 acts as resistance after the stock closed slightly below it, suggesting sellers dominated the session close.
Hourly Chart Analysis: Confirms Downtrend While Hinting at Exhaustion
The 1-hour timeframe shows consistent bearish momentum with price at $120.06, trading beneath all key EMAs: EMA20 at $122.42, EMA50 at $124.99, and EMA200 at $129.85. This confirms a steady downtrend across intraday horizons.
However, the hourly RSI reads 26.47, entering oversold conditions. This signals that near-term selling pressure may be overextended, though oversold levels in a fundamentally bearish context driven by regulatory pressures do not guarantee a reversal.
Additionally, the MACD histogram is marginally narrowing, suggesting bearish momentum could be waning at this scale. The 1H Bollinger Band lower bound at $117.79 marks potential extreme downside if the $119.01 daily support fails.
15-Minute Chart: Signs of Tentative Stabilization
The 15-minute chart presents a mildly improved outlook. The MACD histogram turned slightly positive (+0.03), and the RSI recovered to 37.62. Price closed near session highs at $120.06, holding above the 15-minute pivot at $119.98.
Despite this pause, no substantive reversal has occurred. For a credible bounce, price must reclaim the 15m EMA20 at $120.40 with confirming volume. The relatively contained 15m ATR of $0.45 suggests manageable short-term execution risk.
Bullish Scenario for Alibaba Stock
To shift the bearish narrative, Alibaba stock needs to exceed the daily pivot level of $120.68 and target the $122–$123 range near the 1-hour EMA20. A sustainable close above $125 would mark a meaningful medium-term shift.
Fundamentally, any easing of the Pentagon blacklist designation or a rollback similar to February’s withdrawal could provide strong positive momentum. Clarification that chip export restrictions will not severely hinder Alibaba’s AI infrastructure access would also support a bullish case.
Bearish Scenario: The Path of Least Resistance
Failure to maintain daily support at $119.01 would expose the Bollinger Band bottom near $118.17, with limited technical support before a potential slide towards $115. The Pentagon blacklist imposes a structural constraint, pressuring institutional holders to reduce positions regardless of valuation.
Tightening U.S. chip export controls would also threaten Alibaba’s growth fundamentals by restricting AI infrastructure development, exacerbating the current decline from a temporary pullback to a structural downtrend.
Positioning and Volatility Outlook for Alibaba Stock
Overall, Alibaba stock remains in a compromised technical structure across timeframes, consistent with a bearish outlook. The Pentagon blacklist adds a significant regulatory overhang unlikely to resolve soon. Although the hourly RSI suggests potential short-term exhaustion, any rebound should be approached cautiously as a possible entry point for further declines.
With the daily ATR near $3.89 signaling elevated volatility, risk management remains crucial for traders operating in either direction.


추천 콘텐츠

cirBTC Goes Live as Circle Eyes WBTC’s 85% Share

Zcash Ironwood Upgrade Locks In Consensus Rules, Eyes Late July Activation

Gov’t bolsters social protection


인기 뉴스
더보기
