

Ethereum Price Today Hits $1,674 Amid Bearish Pressure and Soaring DeFi Fees

Ethereum is trading around $1,674–$1,675, showing sustained selling pressure on the daily chart. The gap between current and previous prices represents months of lost momentum, broken supports, and underwater holders. The trend is clearly bearish. However, the question remains whether this marks a point of exhaustion supporting a bounce or a pause before further declines.
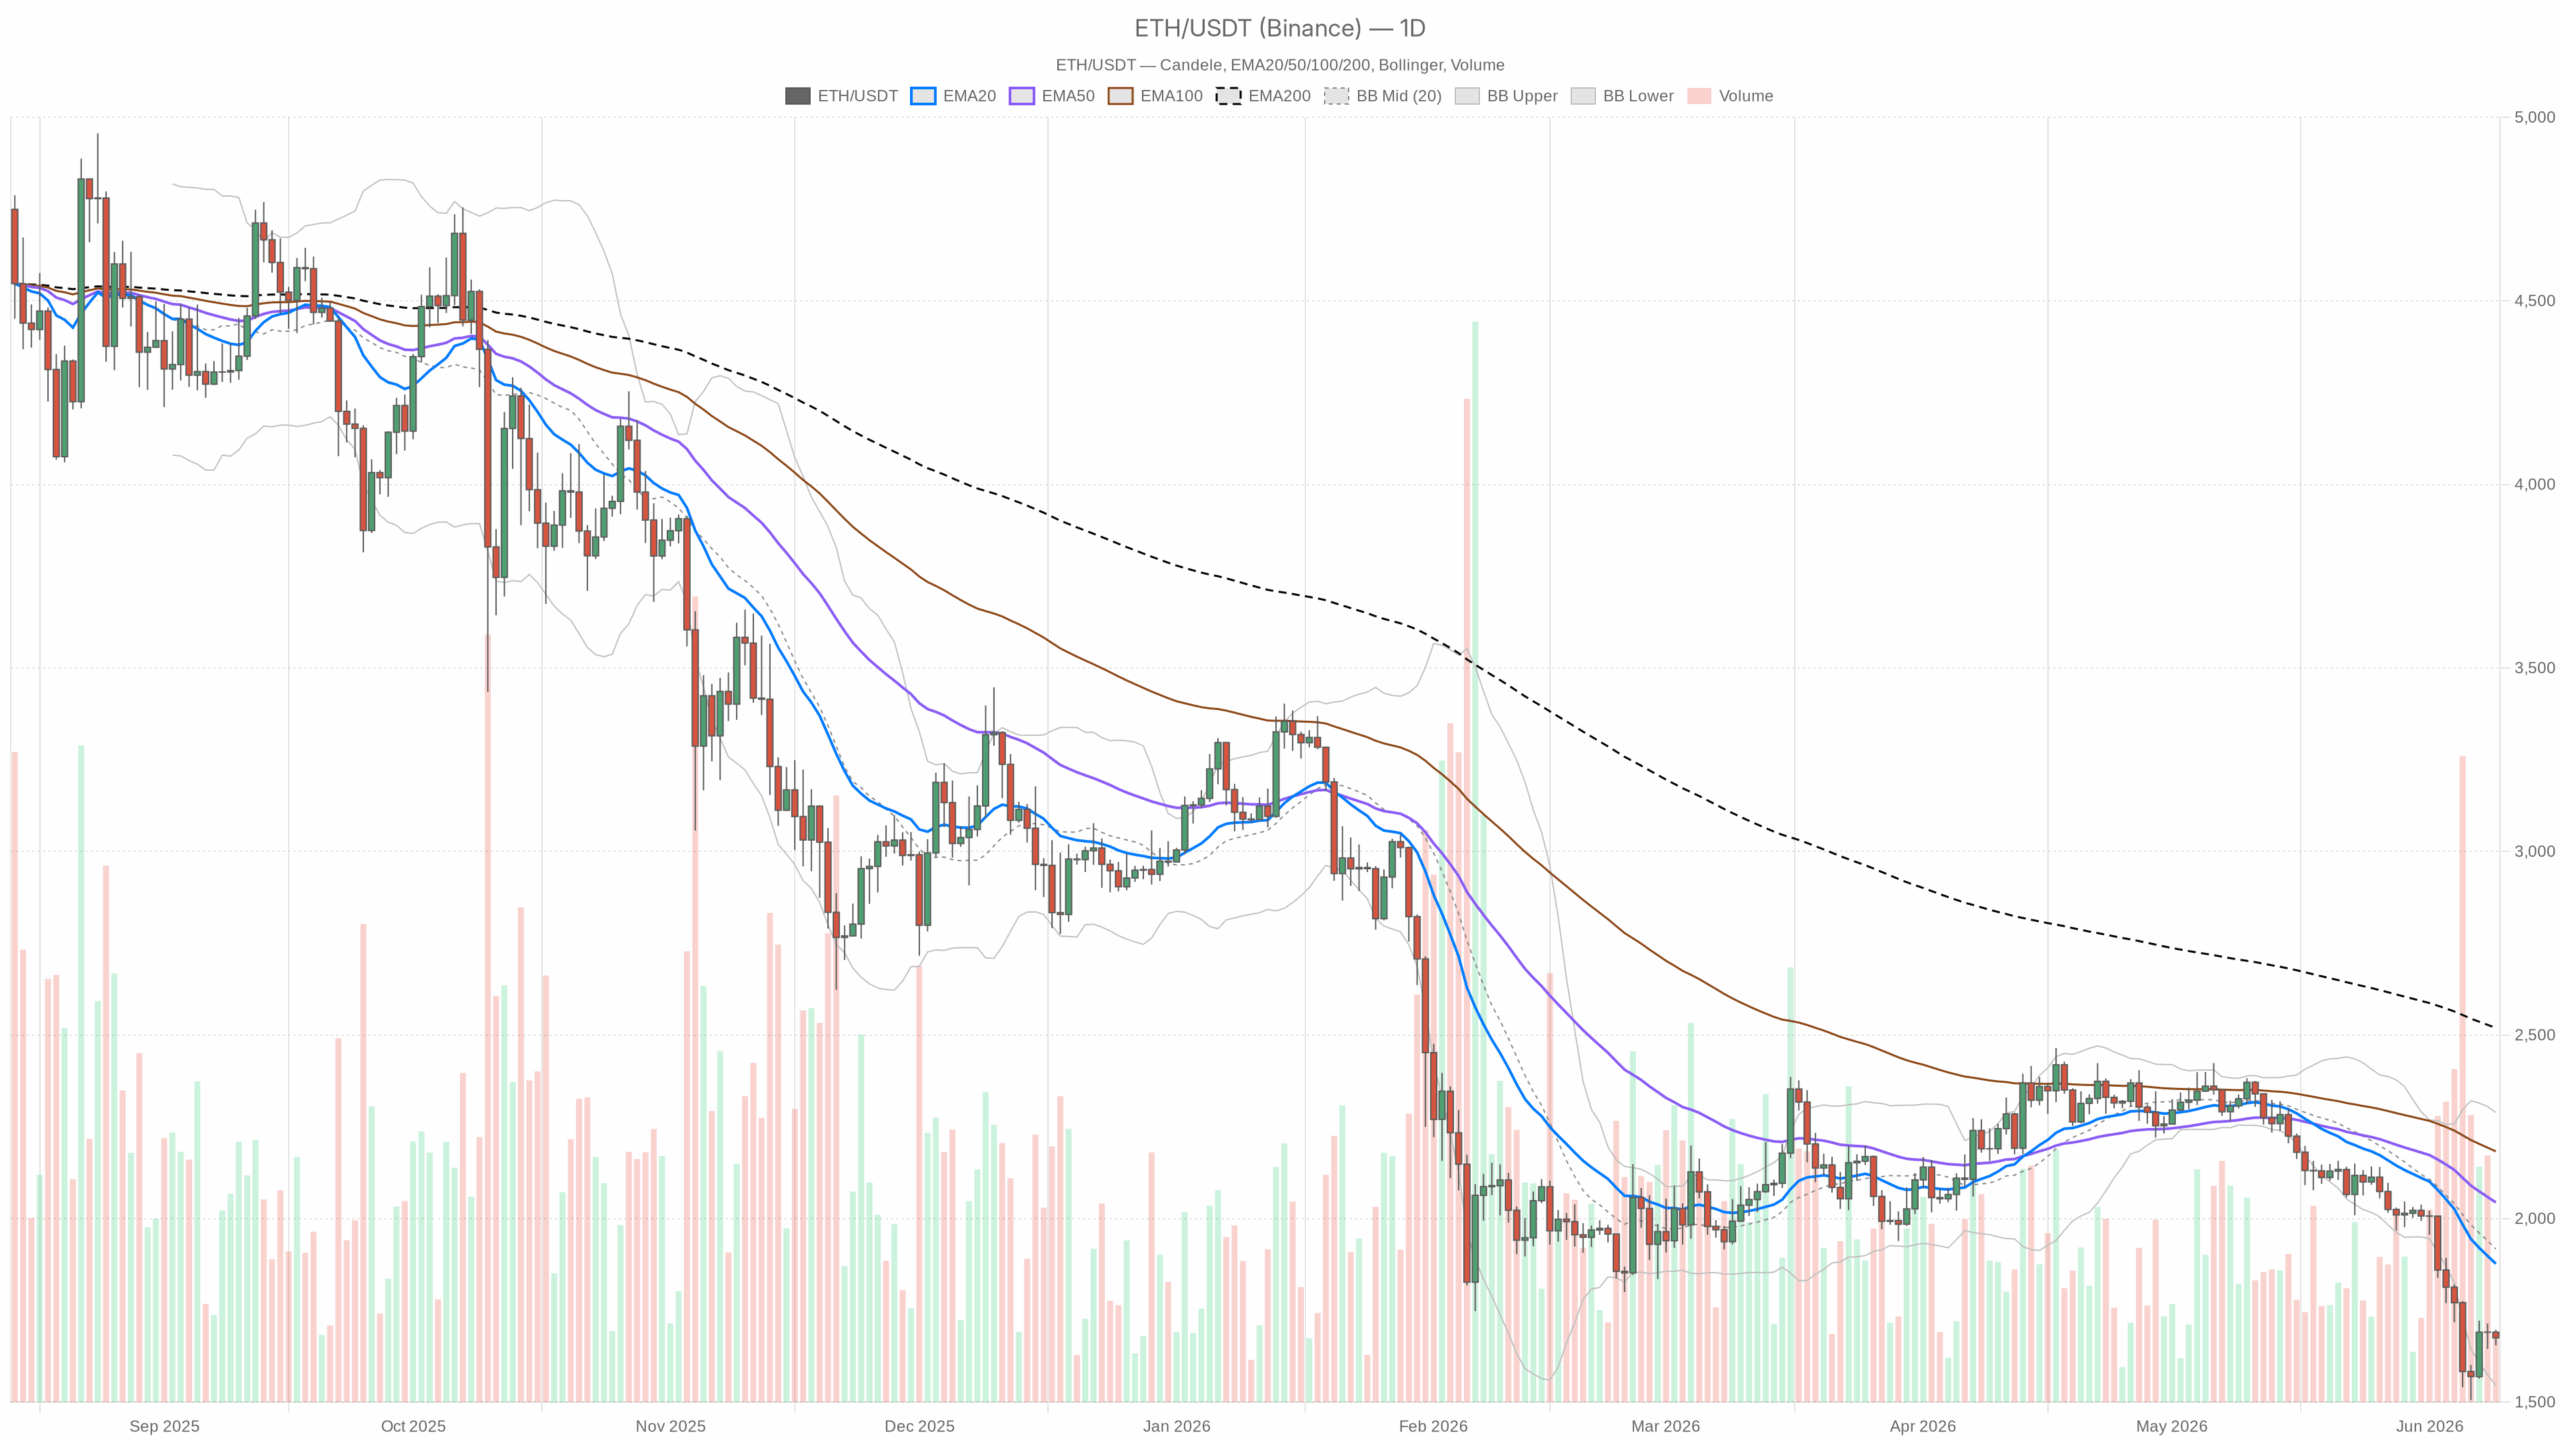 ETH/USDT — daily chart with candlesticks, EMA20/EMA50 and volume.
The Daily Timeframe Tells the Real Story
On the daily chart, Ethereum is below its EMA20 ($1,877), EMA50 ($2,044), and EMA200 ($2,519), forming a bearish stack. Any bullish effort must overcome these resistances before reclaiming a healthy trend. The daily RSI at 27.22 is technically oversold, typically preceding short relief but can remain low during prolonged declines. The MACD shows accelerating downward momentum with a negative histogram of -24.31. Bollinger Bands indicate price compression, with the lower band at $1,545.27 and the ATR at $96.33 signaling significant daily volatility.
Daily pivot points cluster tightly with PP at $1,675.56, R1 at $1,696.48, and S1 at $1,654.23, reflecting no clear directional bias. Price sits on its pivot, indicating hesitation between buyers and sellers in the session.
The Hourly Chart: A Flicker of Indecision
The 1-hour chart softens the bear thesis slightly. The 1H EMA50 at $1,665.70 lies below current price, while the EMA20 at $1,679.23 is nearby. The hourly 200 EMA at $1,740.20 remains a significant resistance. The hourly RSI at 49.21 is neutral, and the MACD displays a bearish crossover, warning that the short-term bounce may be losing energy. Bollinger Bands on this timeframe also suggest a neutral stance, with price near the midline.
15-Minute Context: For Those Watching Entries
The 15-minute chart is less clear. Price is below both the 15m EMA20 ($1,680.77) and EMA50 ($1,681.28). A mild bearish MACD crossover and an RSI of 42.98 lean bearish. The 15-minute pivot levels are extremely tight, just $1 apart, implying an imminent sharp move, though direction remains uncertain.
The DeFi Angle: Activity Is Spiking Despite Price Weakness
In contrast to price weakness, DeFi activity on Ethereum is surging. Uniswap V3 fees spiked 143% in a day, Fluid DEX by 256%, and Curve by nearly 55%. Elevated DEX fees indicate real on-chain volume and active network use, which historically supports Ethereum’s fundamental value.
Two Scenarios Worth Taking Seriously
The bullish case relies on the oversold daily RSI, Extreme Fear sentiment at 10/100, daily pivot support around $1,654–$1,675, and Bollinger lower band acting as a floor. Stabilization here and reclaiming $1,700 with volume could trigger a rally toward $1,800–$1,880. Conversely, a close below $1,545 would invalidate this and open deeper declines.
The bearish continuation case is backed by the daily EMA stack, expanding MACD histogram, and price below major moving averages. Failure of $1,654 support with increased volume could push price below $1,545 and toward $1,400–$1,450. A daily close above EMA20 at $1,877 would invalidate this bearish outlook.
How to Think About Positioning Right Now
The current setup is risky for both directions. The bearish daily structure contrasts with oversold and extreme fear conditions that create potential for sharp short squeezes. The ATR at $96 means high volatility and risk. Holders should watch the $1,545 Bollinger floor closely. Entry seekers should wait for confirmed bounces or a clear reclaim of $1,700. The tight 15-minute pivots suggest an imminent move, typically favoring downside in such conditions.
Ethereum’s network activity remains resilient while its price does not. This disconnect will resolve in time, but timing remains uncertain.


추천 콘텐츠

OORT and Aether Holdings Form Joint Venture to Tackle Financial AI’s Data Bottleneck

GOP strategist: Trump will be on the warpath if Todd Blanche doesn't get confirmed

US-Iran Nuclear Talks Near Breakthrough on 15-Year Freeze, NYT Reports


인기 뉴스
더보기
