

Bitcoin Price Forecast as Goldman Sachs Predicts September Fed Rate Hikes
Key Insights
- Bitcoin price remained under pressure after the Fed decision.
- The bank signaled that it will hike interest rates this year.
- Goldman Sachs analysts predict that it will hike in September.
Bitcoin price retreated for three consecutive days as the recent rebound faded. BTC dropped to $64,200, a few points below this month’s high of $67,115. This retreat may continue in the near term as analysts at Goldman Sachs predicted that the Federal Reserve will hike interest rates as soon as September this year.
Goldman Sachs Sees September Fed Hike
Bitcoin price retreated slightly after the Federal Reserve delivered its interest rate decision. In it, officials decided to leave interest rates unchanged between 3.50% and 3.75%.
The most important part of this meeting was Kevin Warsh’s statement, since this was his first time as the Federal Reserve Chair. In his statement, he noted that he was establishing some task forces as he seeks to reshape the bank.
Most importantly, nine of the bank’s officials said that they support hiking interest rates because of the ongoing inflationary environment. A few months ago, economists were expecting the bank to cut rates later this year.
In a statement today, June 18, a top Goldman Sachs analyst predicted that the bank may cut as early as September this year. This is much sooner than what the CME Fed Futures Tool predicts. A Polymarket poll predicts that the odds of a hike rose to 55%.
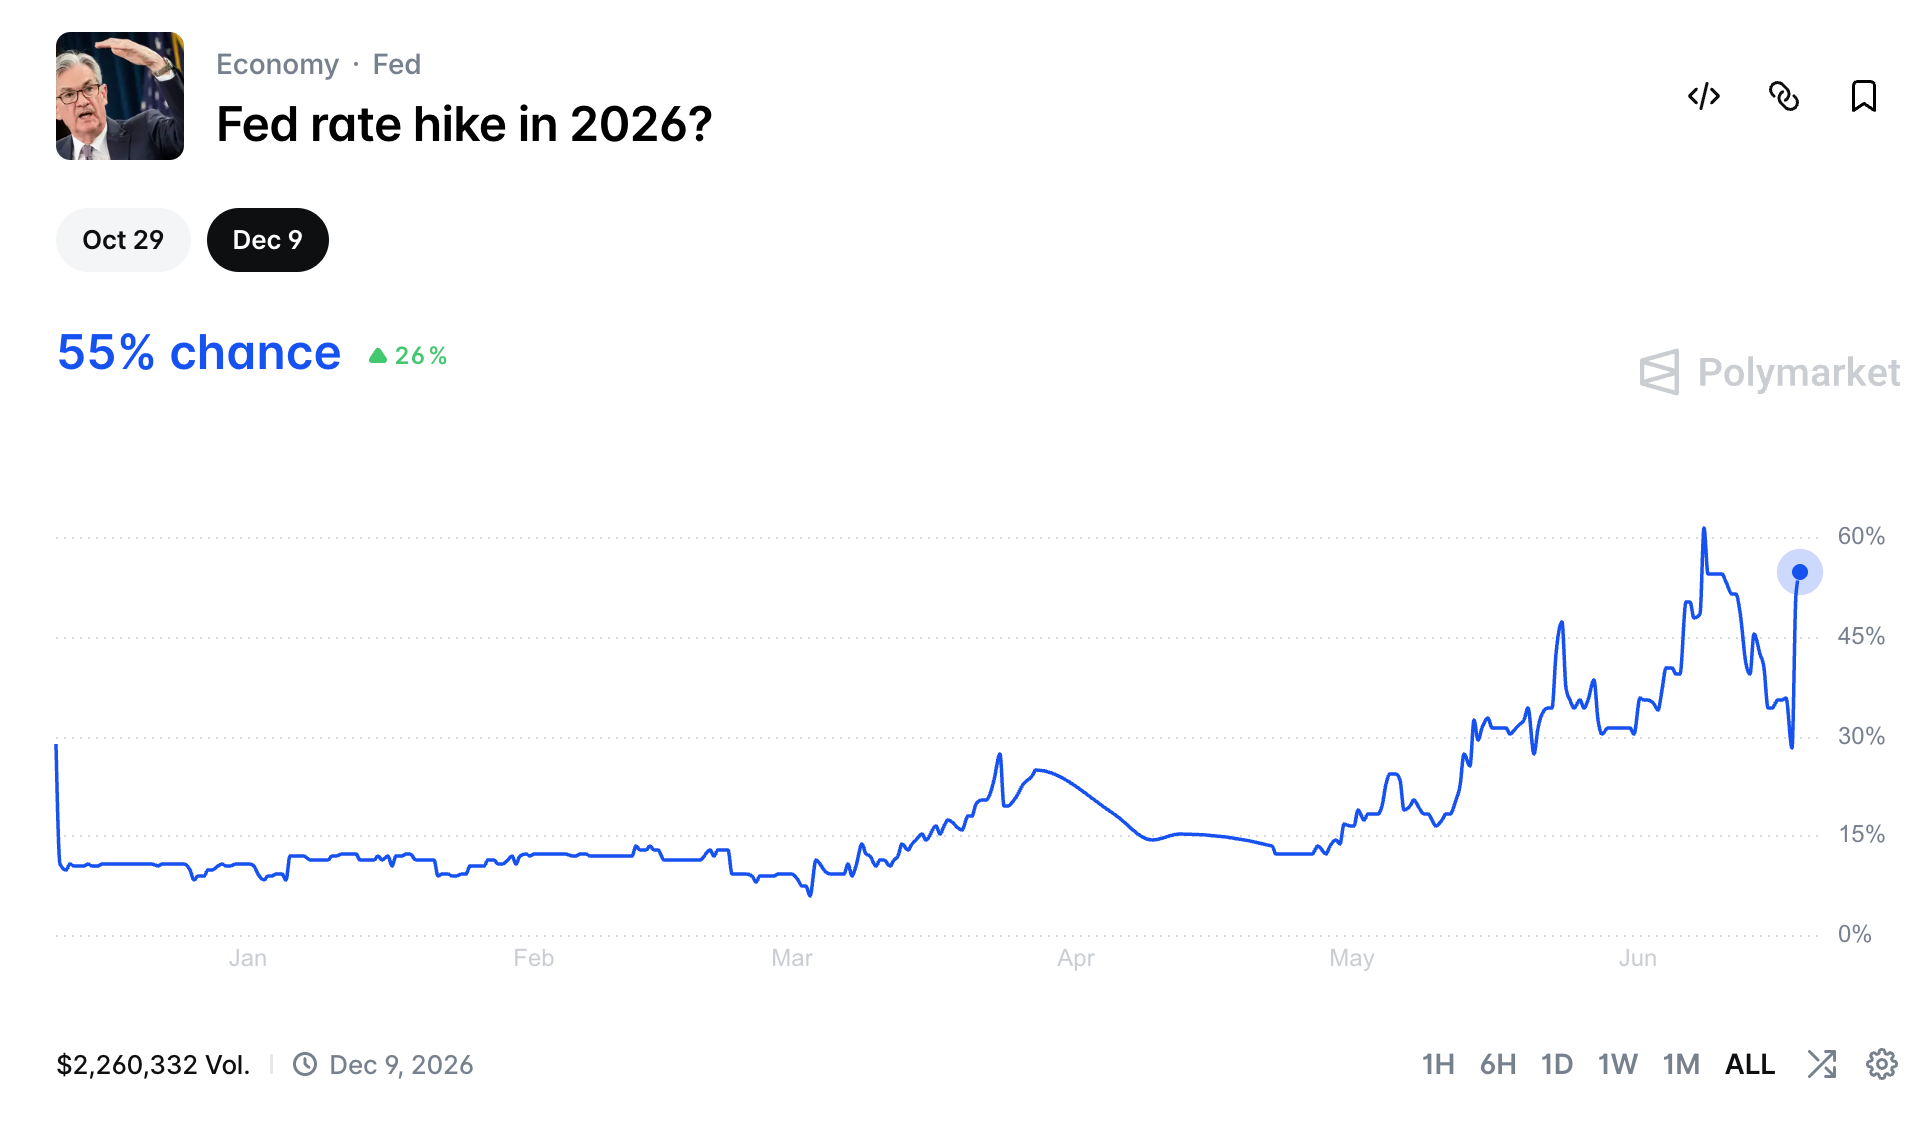 Fed rate hike odds | Source: Polymarket
The bond market is sending a signal that investors expect the Fed to start hiking interest rates. For example, the two-year bond yield jumped to 4.197%, its highest level since February 18, and much higher than the year-to-date low of 3.36%.
Similarly, the five-year yield jumped to 4.252%, its highest point since February this year. Also, long-term bond yields have continued to rise after the Federal Reserve decision.
Crypto prices normally do well in periods when the Federal Reserve is either cutting interest rates or when it is hinting at future cuts. A good example of this is what happened in 2022 when Bitcoin tumbled below $16,000 as the bank was hiking rates.
Bitcoin Demand is Falling in Key Markets
Meanwhile, data shows that Bitcoin demand is falling in key markets like the United States, South Korea, and Japan, where the stock markets have soared to their record highs.
For example, data shows that Bitcoin ETFs shed over $82 million in assets on Wednesday, bringing the monthly outflows to $2.1 billion. These funds shed $2.4 billion in assets in May, bringing the cumulative net inflow to $53 billion. They now hold $80 billion in assets, down from over $140 bilion at the peak.
The outflows have continued as investors have turned to the stock market, where the returns are stronger. For example, the Nasdaq 100 Index jumped by over 20% this year. Other indices, such as the Dow Jones and the S&P 500, have soared to record highs.
The same trend is happening in other countries, such as South Korea, where the Kospi has jumped by over 70% this year. Japan’s Nikkei 225 Index has jumped to a record high, drawing more investors.
Bitcoin Price Prediction: Technical Analysis
 BTC price chart | Source: TradingView
BTC price has dropped in the past three consecutive days, moving from a high of $67,115 on June 15 to the current $63,970. A closer look shows that the coin has formed the highly bearish inverted cup-and-handle pattern. This pattern is made up of an inverted rounded top and a handle.
The coin has also remained below the 50-day weighted moving average (WMA), a sign that bears remain in power. Also, the Relative Strength Index (RSI) has dropped to 37. Therefore, the coin will likely continue falling in the near term, with the next key level being at $60,000. Crashing below this price will point to more downside towards $50,000.
The post Bitcoin Price Forecast as Goldman Sachs Predicts September Fed Rate Hikes appeared first on The Market Periodical.


추천 콘텐츠

Ethereum koers toont zeldzaam dubbel koopsignaal en richt zich op $4.550

UK Gilt Yields Spike As Burnham Win Opens Door To Oust Starmer

HashKey Capital’s Strategic $540K STO Deposit to Binance Reveals Institutional Crypto Moves Amid Market Turmoil


인기 뉴스
더보기
