

XRP Price Prediction: Will Ripple Hit $10 or $17 This Cycle?
XRP Price Prediction: Can Ripple Reach $10 or $17 After the Breakout?
XRP is back in the spotlight. After a breakout that caught many traders off guard, analysts are now pointing to price targets as high as $17. Some are even looking further.
The question is not just where XRP can go. It is how long most people will hold on to get there.
What Does the XRP Chart Look Like Right Now?
On the long-term chart, the altcoin has formed a clear pattern of descending triangles followed by sharp recoveries.
The most recent structure shows a false breakdown near the $0.85 to $1.00 zone, which acted as a launchpad. After that, the price surged to the $3.24 area in mid-2024.
Since then, Ripple has been consolidating in a smaller triangle pattern. Analyst Javon Marks says this breakout still stands.
Why is Javon Marks watching a $17 XRP Target?
Javon Marks, a widely followed crypto analyst, said the measured move target near $17 remains valid as long as the current breakout holds.
He pointed out that his team correctly called the move from around $0.50 to $3.30 earlier.
Based on the same methodology, a move greater than 12X from current levels would be needed to reach $17.
That would represent roughly a 1,100% increase from the $1.15 area where it was trading at the time of writing.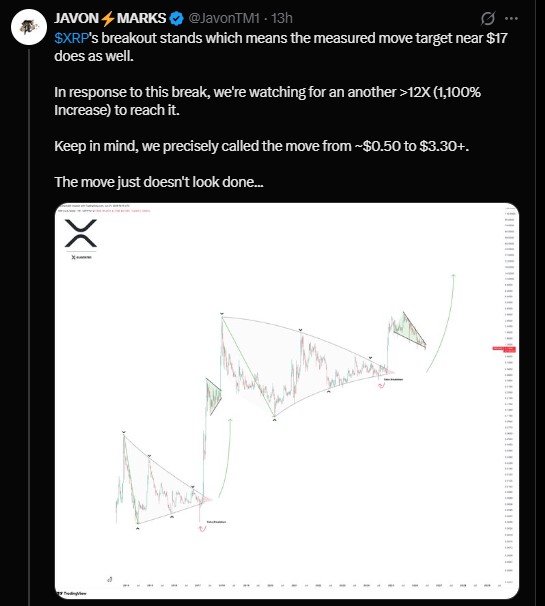
What Is the CryptoPatel XRP Analysis Saying?
A separate monthly chart from CryptoPatel shows a different but compatible view.
The chart labels the $0.50 to $1.00 band as an accumulation zone. From that base, a breakout already occurred and pushed toward $3.24.
The projection in that chart maps a possible correction back toward $0.85 to $1.00, followed by a second and much larger leg up targeting $9.20 by 2027 or 2028.
That $9.20 level represents roughly a 1,245% move from the base, and the chart labels $10.00 as the long-term target zone.
What Is the EGRAG Crypto View on XRP Patience?
EGRAG Crypto, another respected voice in the community, framed the situation differently.
The road to $10 will not reward the smartest traders. It will reward the most patient ones.
That view aligns with the long-term chart data. Every major move took time, and each breakout followed a long period of quiet consolidation.
What Do XRP Derivatives Numbers Show?
The derivatives data tells a clear story right now.
As per CoinGlass data, the 24-hour long/short ratio on Binance stands at 2.639 for regular accounts. Top trader accounts show a ratio of 2.9793 for long/short by accounts and 1.7456 by position size.
This means more traders are positioned for upside than downside across major platforms, including OKX, where the long/short ratio is 2.48.
The 24-hour liquidation data shows $2.29 million in longs were wiped versus $533,970 in shorts, meaning shorts have been getting squeezed more aggressively.
Open interest sits at $2.60 billion, down slightly by 1.05%. Volume is up 36.33% to $1.93 billion over 24 hours, showing elevated activity.
Is the US Senate Clarity Act a Factor for Ripple?
Senate leaders are holding emergency meetings to push the Clarity Act forward before the current legislative window closes.
If passed, the Clarity Act would give crypto assets a clearer regulatory status in the United States.
XRP, which has been at the center of a multi-year SEC lawsuit, could benefit significantly from such clarity.
Regulatory certainty has historically acted as a catalyst for price moves. Traders are watching this development closely.
Could XRP Still Drop Before Moving Higher?
Yes, and that is part of the scenario some analysts are tracking.
The CryptoPatel chart shows a potential pullback to the $0.85 range before the next major move begins. That drop would represent around 71% from the 2024 peak.
Nothing in crypto moves in a straight line. A return to the accumulation zone does not cancel the larger bullish thesis for many analysts.
Summary of Key Price Levels to Watch
-
Support zone: $0.85 to $1.00
-
Current resistance area: $2.40 to $3.24
-
Mid-term target: $9.20 (CryptoPatel)
-
Long-term target: $10.00 (CryptoPatel long-term resistance)
-
Extended target: $17.00 (Javon Marks measured move)
Disclaimer
This article is for informational purposes only and does not constitute financial advice. Cryptocurrency investments carry significant risk, including the potential loss of all capital. Always conduct your own research and consult a licensed financial advisor before making any investment decisions.


추천 콘텐츠
MEXC Lists Arcium (ARX) with 70,000 USDT in Airdrop+ Rewards

Ethereum Stablecoin Supply Contracts: USDT Down 2.83%, USDC Down 2.72% Over 30 Days

Morgan Stanley Undercuts Rivals — Launches Ethereum and Solana ETFs


인기 뉴스
더보기
