

Cross (CROSS) Price Prediction 2026–2030: Can CROSS Hit $0.20 Soon?
What to Know
- CROSS is attempting to reclaim the Bollinger Band midpoint after weeks of sustained selling pressure.
- RSI has recovered to 47, signaling improving momentum as buyers gradually regain control.
- Long-term projections suggest CROSS could challenge the $0.20 psychological level before 2030.
Cross (CROSS) is showing early signs of recovery after enduring several weeks of persistent selling that pushed the token toward its lowest levels since April. The latest TradingView chart shows CROSS trading around $0.0857, posting a modest daily gain while attempting to reclaim the Bollinger Band midpoint near $0.0872. The Relative Strength Index (RSI) has climbed to 47.02, rising above its RSI moving average of 41.62. Although the indicator remains below the neutral 50 level, the recent rebound suggests bearish momentum is fading and buyers are gradually returning.
Price remains below the upper Bollinger Band at $0.0988, indicating the broader trend has yet to turn decisively bullish. However, maintaining the recent recovery could allow CROSS to build momentum during the second half of 2026.
Also Read: Opinion (OPINION) Price Prediction 2026–2030: Can OPINION Hit $0.10 Soon?
Recovery Attempt Emerges After Extended Downtrend
CROSS spent much of May and June trading inside a descending trend as sellers repeatedly defended rallies near the upper Bollinger Band. Each recovery attempt was met with renewed selling pressure, forcing price toward the lower band around $0.0757.
Recent trading sessions have started to shift that picture. Buyers successfully defended the lower Bollinger Band and pushed the token back toward the middle band. While the move remains modest, it suggests selling pressure is easing after several weeks of weakness. A sustained move above the Bollinger midpoint would improve the short-term technical outlook and increase the probability of testing higher resistance levels.
Technical Analysis
The technical structure is beginning to stabilize. CROSS currently trades slightly below the 20-day Bollinger Band average at $0.0872, while the upper band remains at $0.0988. A decisive close above the middle band could trigger further upside toward the upper resistance zone. The RSI reading of 47.02 reflects improving momentum without entering overbought territory. This leaves room for additional gains if buying activity continues over the coming sessions.
Immediate resistance sits around $0.090–$0.099, where previous rallies have stalled. A breakout above this region could expose the psychological $0.10 level before targeting higher prices. On the downside, initial support lies near $0.082, followed by the lower Bollinger Band at $0.0757. Losing this support could revive bearish momentum.
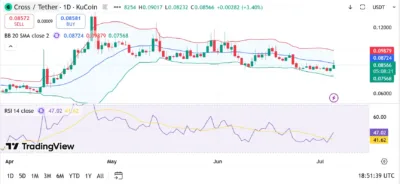
Source: Tradingview
Cross (CROSS) Price Predictions (2026–2030)
| Year | Minimum Price | Average Price | Maximum Price |
|---|---|---|---|
| 2026 | $0.080 | $0.100 | $0.120 |
| 2027 | $0.095 | $0.125 | $0.145 |
| 2028 | $0.110 | $0.145 | $0.170 |
| 2029 | $0.130 | $0.170 | $0.190 |
| 2030 | $0.150 | $0.185 | $0.220 |
Yearly Insights
2026
CROSS could continue recovering if buyers establish support above the Bollinger midpoint and reclaim the $0.09 region.
2027
Improving market sentiment and broader cryptocurrency adoption may help the token challenge the $0.15 level.
2028
Higher network activity and stronger investor participation could support another leg higher toward $0.17.
2029
If bullish market conditions persist, CROSS may continue building its long-term uptrend and approach $0.19.
2030
A favorable crypto market cycle and sustained ecosystem growth could allow CROSS to test the $0.20 psychological level.
Conclusion
CROSS is attempting to reverse its recent downtrend after bouncing from the lower Bollinger Band. The recovery in RSI and the move toward the Bollinger midpoint indicate that buying momentum is gradually strengthening, even though bulls have not yet confirmed a breakout.
The next major test remains the resistance between $0.09 and $0.10. Clearing that zone would significantly improve the technical outlook and could pave the way for stronger gains over the longer term. Until then, traders should monitor whether CROSS can hold above nearby support while momentum continues to improve.
FAQs
1. Is CROSS showing bullish momentum?
Momentum is improving as RSI rebounds toward the neutral 50 level, although a confirmed bullish trend has not yet formed.
2. What is the next resistance level?
The immediate resistance lies between $0.090 and $0.099, followed by the important $0.10 psychological level.
3. Where is the strongest support?
Key support sits near $0.082, with stronger support around the lower Bollinger Band at $0.0757.
4. What does the RSI indicate?
An RSI of 47.02 suggests bearish momentum is weakening while buyers gradually regain strength.
5. Can CROSS reach $0.20?
If adoption grows and the broader cryptocurrency market enters another sustained bull cycle, CROSS could potentially challenge $0.20 by 2030.
Also Read: Secret (SCRT) Price Prediction 2026–2030: Can SCRT Hit $0.10 Soon?
The post Cross (CROSS) Price Prediction 2026–2030: Can CROSS Hit $0.20 Soon? appeared first on 36Crypto.


추천 콘텐츠

U.S. Stock Market Hits Record $81T As Mega-Cap Lead Widens

FTEC vs. VGT: Same Tech Bet, So Which Fund Costs You Less?
Strategy Sells 3,588 Bitcoin to Fund STRC Dividends as MSTR Shares Slip


인기 뉴스
더보기
