How to View Positions and Funds in MEXC Futures Account

1. What Is Futures Trading Volume?
2. What Is FuturesOpen Interest?
3. What Is the Significance of Changes in Futures Trading Volume and Open Interest?
3.1 Significance of Futures Trading Volume
3.2 Identifying Breakouts vs. False Breakouts
3.3 Significance of Open Interest
3.4 Combining Trading Volume and Open Interest for Sentiment Analysis
4. Combined Analysis of Trading Volume and Open Interest
5. Practical Guide: How to Use Trading Volume and Open Interest to Inform Futures Trading
5.1 Confirming Trend Strength
5.2 Distinguishing Breakouts From False Breakouts
5.3 Analyzing Bullish and Bearish Sentiment
5.4 Risk Management and Strategy Adjustments
- Extremely High Open Interest: When open interest reaches very high levels, the market becomes prone to sharp volatility (e.g., liquidations or short/long squeezes). Lower leverage is advised to manage risk.
- Extremely Low Open Interest: When open interest is very low, the market trend may be weak, making short-term trades or staying on the sidelines more appropriate.
6. How to Track Changes in Open Interest
7. How to Check Your Positions
Recommended Reading
- Why Choose MEXC Futures? Gain an in-depth understanding of MEXC Futures trading advantages and features to help you seize opportunities in the Futures market.
- How to Trade Futures on MEXC App Learn the detailed trading process on the App, allowing you to get started easily and master Futures trading.
Popular Articles
View More
Highest Leverage Crypto Exchanges in 2026: Only Two Survive the 500x Test
Two major crypto exchanges currently sit at the top of the leverage ladder: MEXC and BTCC both list futures contracts at up to 500x, while most large rivals cap out between 100x and 125x. MEXC pairs

Can You Trade Stocks and Crypto in One App? Best Platforms Compared (2026)
Yes, you can trade stocks and crypto in one app, but your real options depend on where you live. US residents can pick from Robinhood, Coinbase, Kraken, or Crypto.com. UK and EU investors have eToro

How to Buy Stocks Online Without a Broker: 6 Ways Banks Won't Tell You About
Yes, you can buy stocks online without a broker. US investors can use direct stock purchase plans, dividend reinvestment plans, or employer plans, while zero-commission apps remove the human

MSFT Price Target: Zero Sell Ratings and a $100 Billion Azure Year, So Why Won't Microsoft Stock Close the Gap?
Microsoft (NASDAQ: MSFT) just closed its fiscal year with a quarter that beat Wall Street on every headline number — and the stock still trades roughly 24% below where the average analyst says it
Hot Crypto Updates
View More
Microsoft FY2026 Q4 Earnings Beat Estimates as Azure Growth Accelerates and MSFT Stock Jumps
When Were the Microsoft Q4 FY2026 Earnings Released? Microsoft announced its fiscal fourth-quarter 2026 earnings after the U.S. market closed on Wednesday, July 29, 2026. The quarter covered the

SPY Price Prediction 2026–2030: Bull, Base and Bear Market Scenarios
Summary SPY closed at $740.86 on July 28, 2026. State Street reported a forward P/E of 21.59x and estimated three-to-five-year portfolio earnings growth of 17.38%. The following ranges are

STM Stock Price Prediction 2026–2030: Bull, Base and Bear Scenarios
Summary STM closed near $53.45 on July 27, 2026 after falling sharply following Q2 earnings. The stock had previously reached approximately $81.42 in early June, illustrating the unusually wide range

Trending News
View More
Samsung Q2 Profit Jumps 19x, But Shares Fall: Why AI Memory Stocks Face a Higher Bar
Samsung Electronics recently guided its Q2 2026 revenue at approximately KRW 171 trillion with an operating profit of KRW 89.4 trillion—an astonishing 19-fold jump from a year earlier. On paper, this

Tesla Q1 2026 Earnings Review: Deliveries Rebounded, But Margin Quality Remains the Real Test
Tesla reported its Q1 2026 financial results on April 22, 2026, after the U.S. market close. The company delivered 358,023 vehicles in the quarter, generated total revenue of $22.4 billion, and report
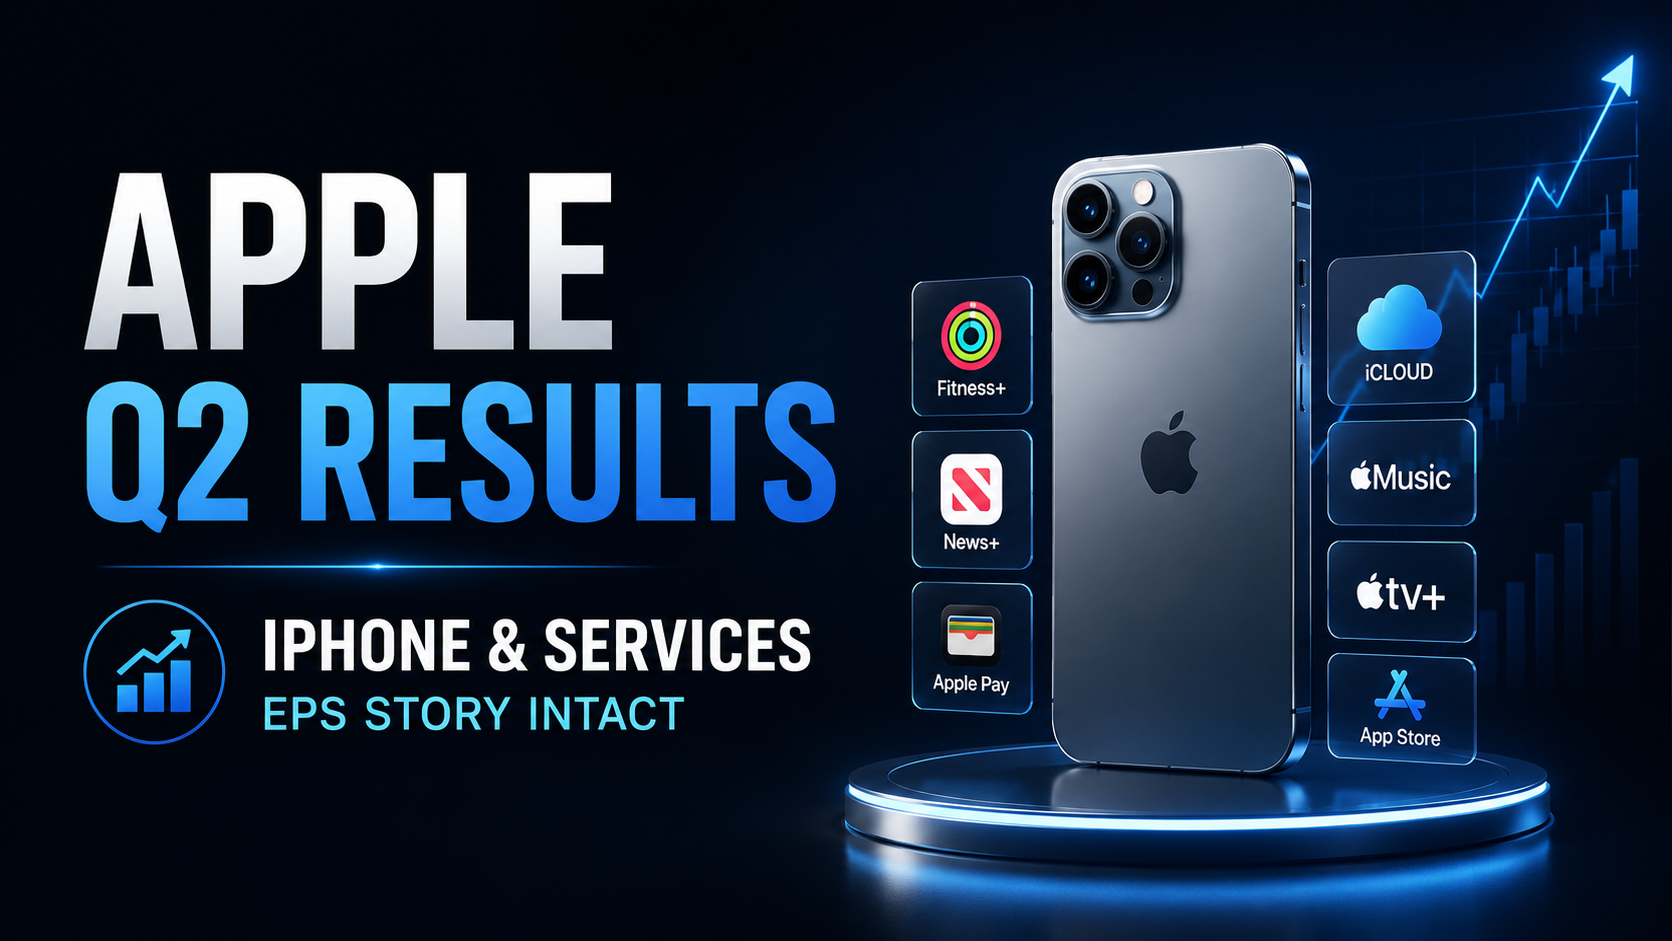
Apple FY2026 Q2 Earnings Review: iPhone Revenue and Services Growth Keep EPS Story Intact
Apple reported fiscal 2026 second-quarter results on April 30, 2026, covering the quarter that ended March 28, 2026. Revenue reached $111.2 billion, up 17% year over year, while diluted EPS rose 22% t

Hyperliquid Open Interest Hits $11.5 Billion: Are On-Chain Perpetuals Expanding into U.S. Equity Markets?
Hyperliquid’s open interest has reached approximately $11.5 billion, a new high for 2026, with HIP-3 markets contributing nearly $4 billion. The S&P 500-linked contract has become the largest HIP-3 ma
Related Articles
View More
Zero Threshold, Zero Slippage: How to Trade U.S. Stock Futures on MEXC
Recently, AI concept stocks have surged dramatically, with tech giants' valuations reaching record highs, placing the U.S. stock market firmly in the spotlight for global investors. However, most cryp
How to Rearrange the Open Position Information Columns in Futures Trading
In Futures trading, once you have opened a position, it will appear under Open Position. The Open Positions list includes Trading Pair, Position, Avg Entry Price, Fair Price, Est. Liq Price, Margin Ra
How to Export Futures Position History Data
In futures trading, mastering and analyzing your historical trade data is the first step toward becoming a more experienced trader. MEXC's newly launched Futures Position History data export feature p