

XRP Price Prediction: 100 EMA Signals Move as Bulls Hold Support, Breakout Looms Near $1.43 Pivot
While momentum indicators remain balanced, analysts are increasingly focused on key exponential moving averages that could define the next directional move.
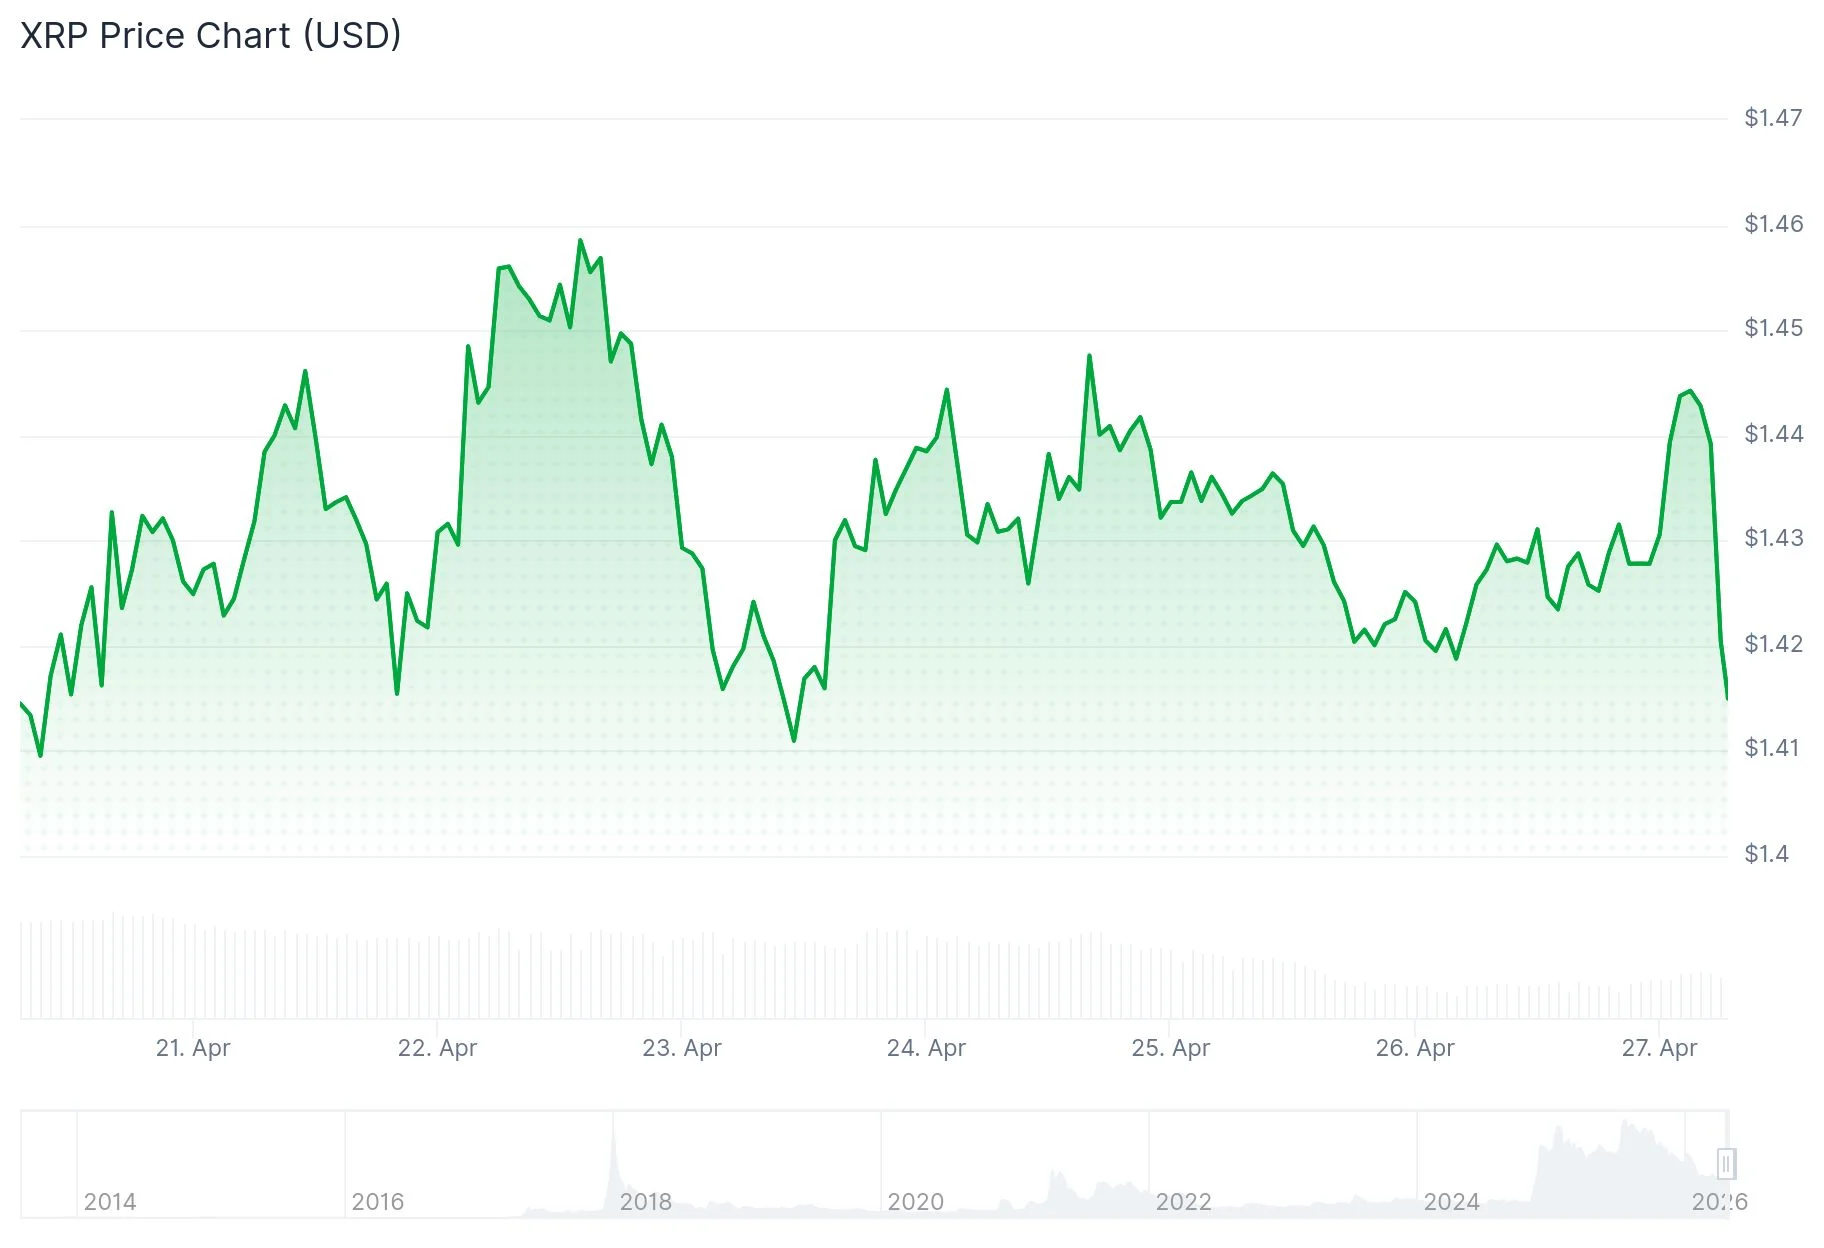
The current XRP price is hovering near $1.42, reflecting modest intraday fluctuations. Despite the lack of a strong directional bias, the broader structure shows early signs of stabilization after a prolonged corrective phase.
XRP Price Today Holds Key Support as EMA Structure Tightens
Recent chart analysis shared by crypto analysts, including insights referencing EGRAG CRYPTO’s framework, points to a developing setup centered around the 50 and 100 exponential moving averages. According to the analysis, XRP is “holding the 50 EMA as support,” a level that has so far absorbed selling pressure.
The monthly XRP chart indicates the 100 EMA as a key upcoming level, with price holding the 50 EMA as support and a potential shallow retest signaling strengthening structure and diminishing selling pressure. Source: EGRAG CRYPTO via X
The same outlook suggests the possibility of a “shallow wick toward the 100 EMA,” indicating a controlled retest rather than a breakdown. This type of price behavior often reflects a maturing market structure where volatility compresses before expansion.
From a technical standpoint, shorter-term EMAs, including the 10, 20, 30, and 50 periods, are all trending below the current price and issuing buy signals. This alignment signals that recent price action is finding support on pullbacks, offering a constructive near-term outlook for the XRP crypto price.
However, the broader trend remains constrained. The 100 and 200 EMAs, positioned well above the current price, continue to act as overhead resistance. This divergence between short-term support and long-term resistance highlights a transitional phase in the XRP price chart.
Neutral Momentum Reflects Market Indecision
Momentum indicators reinforce the ongoing consolidation narrative. The Relative Strength Index (RSI) is positioned near 54, indicating a neutral stance with no immediate signs of overbought or oversold conditions.
 XRP was trading at around $1.42, down 0.43% in the last 24 hours at press time. Source: XRP price via Brave New Coin
Other oscillators, including the stochastic RSI, commodity channel index, and average directional index, also cluster around mid-range levels. This alignment suggests the market lacks the momentum required for a sharp breakout.
The MACD remains a notable exception. It has flashed a mild buy signal, hinting at the potential for short-term upside if confirmation follows. Still, this signal is not yet strong enough to shift the overall XRP price prediction decisively.
In practical terms, this means traders are waiting for confirmation. The current environment reflects equilibrium, where buying and selling forces are nearly balanced.
Pivot Levels Place $1.43 Zone in Focus
Key pivot levels provide a clearer roadmap for near-term price action. The central pivot sits around $1.41, with XRP trading slightly above it. This positioning offers a mild bullish tilt but remains far from a confirmed breakout.
 XRP price is expected to extend its pullback toward a key demand zone, where a buy setup awaits confirmation through a strong higher-timeframe rejection. Source: ryanthadon_ on TradingView
Immediate resistance is located near $1.51, followed by higher levels at $1.72 and $2.04. On the downside, support begins around $1.22, with deeper levels extending toward $1.10 and below.
This structure places the $1.41–$1.43 range at the center of current price activity. A sustained move above this zone could open the path toward higher resistance levels. Conversely, losing this support may reintroduce downside pressure.
Macro Context: XRP Price and Market Structure Stabilization
The current XRP price today reflects more than just technical consolidation—it also aligns with a broader structural phase across the crypto market. Many digital assets are transitioning from high-volatility corrections into accumulation ranges, where price stability gradually replaces aggressive swings.
In this context, XRP’s behavior around key EMAs suggests a shift from distribution to accumulation. The concept of accumulation ranges, defined by strong reactions at specific candle structures, indicates that buyers are quietly positioning at lower levels.
This structural transition is important for longer-term XRP price prediction 2025 outlooks. A stable base often precedes sustained trends, especially when selling pressure begins to fade and liquidity returns to the market.
At the same time, lingering macro uncertainties, including regulatory developments tied to the XRP SEC narrative, continue to limit aggressive bullish sentiment. This balance between improving technical structure and cautious macro conditions explains the current neutral stance in XRP news today.
XRP Price Prediction: Balanced Outlook with Breakout Potential
Overall, the XRP price forecast remains balanced. Short-term indicators suggest support is holding, while long-term resistance continues to cap upside momentum.
The market is not signaling an immediate breakout. Instead, it is building a foundation. A confirmed move above short-term resistance, supported by stronger volume and momentum, would be required to shift sentiment toward a more bullish trajectory.
 XRP price structure highlights accumulation and distribution ranges, where key candle formations define dynamic support and resistance levels that signal potential trend reversals. Source: StudyGuideTA on TradingView
Until then, XRP remains in a consolidation phase where patience is key. As technical signals converge near the $1.43 pivot, the next move, whether upward or downward, will likely define the near-term trend for XRP.
For now, the data points to a market preparing for its next phase rather than actively trending, keeping the XRP prediction cautiously neutral with a slight upward bias.


You May Also Like
XRP Enters Compression Zone as Analysts Forecast Major Breakout Potential

Bitcoin at Crucial Pivot Point, Here's Why Fed Can Tilt Balance


