Bitcoin Price Today: BTC Breaks $81K, But On-Chain Activity Hits 2-Year Lows – Here’s the Data
Bitcoin broke past $81,000 today for the first time since late January. That’s good news for crypto. But we are still in a bear market. So the real question is: can this rally last?
Santiment posted data that throws cold water on the move. On-chain activity just hit two-year lows. Normally, a Bitcoin price rally brings more users and more wallets. That’s not happening. Let’s dig into what that means.
Santiment: Bitcoin On-Chain Activity Falls to 2-Year Lows
Santiment tweeted the numbers. Bitcoin has 531,000 active wallets making transfers daily. The network creates 203,000 new wallets daily. Both numbers are scraping two-year lows.
Here’s the disconnect. Bitcoin just returned above $80,000 for the first time in three months. Yet network activity keeps falling. You’d expect rising prices to attract more users. More wallet creations. More on-chain buzz. That’s not the case.
Instead, price climbs on thin participation. A smaller group of players pushes the market higher. There’s no broad wave of new or returning users. The price rose 22% in the past five weeks. But the foundation looks weak.
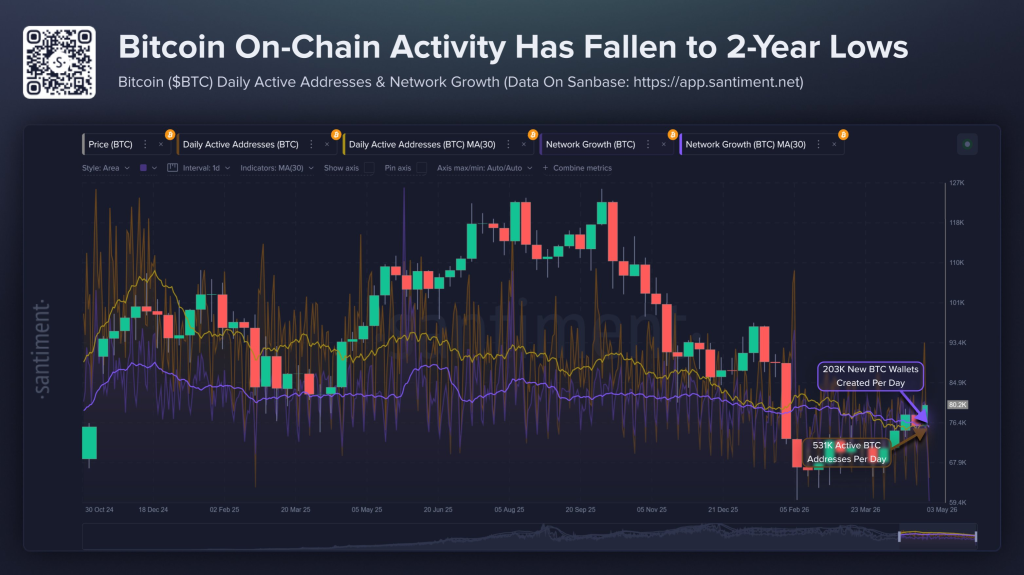 Source: X/@SantimentData
When only a few addresses stay active and new wallets barely grow, large-scale adoption isn’t here. Historically on Santiment’s data, price increases without growing on-chain participation break easily. There’s less buying fuel behind the move. If big holders take profits, fresh demand from new users may not absorb the selling.
Here’s the paradox. Two-year lows in network activity can also mean Bitcoin is coiled for a much bigger move upward. Activity bottoms often mark the end of apathy. If price already recovers to $80,000 with participation this low, imagine what happens when retail interest finally wakes up. Daily active addresses climbing back toward the 100K+ new wallet levels from 2024–2025 would light a fire.
Ali Martinez: Weekly MACD Crossover Says $100,000 Is Possible
Crypto analyst Ali Martinez shared a weekly Bitcoin chart. He asked a direct question: is Bitcoin heading to $100,000?
BTC continues to show structural strength. On April 13, a bullish MACD crossover appeared on the weekly chart. Since then, price rose 15% steadily.
This specific weekly crossover has a strong track record:
- October 23, 2023: led to a 147% rally.
- October 14, 2024: resulted in a 75% rally.
- May 5, 2025: led to a 35% rally.
Each time, the crossover marked the start of a multi-month trend. Now we have another one from April 13, 2026.
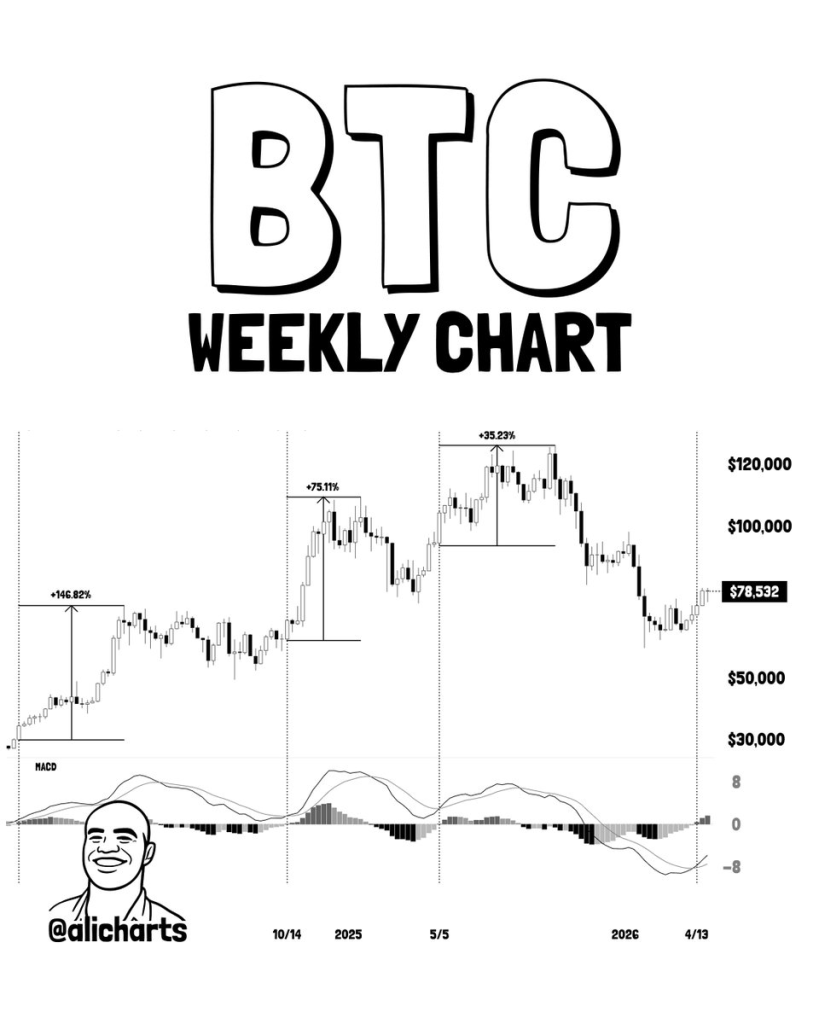 Source: X/@alicharts
On the daily chart, Bitcoin approaches the 200 SMA at 83,000. That’s the biggest psychological and structural barrier right now. A clean daily close above 83,000 clears the path for macro expansion toward 89,000. The next target after that sits at 94,000.
The weekly chart shows price up 35.23% from the crossover low. MACD lines turned positive. The histogram flipped green. Momentum is building, not fading. If history repeats, this rally has room to run.
Why Is Bitcoin Price Rising Today (May 5)?
Several forces pushed Bitcoin past $81,000.
Strong institutional flows provided a tailwind. U.S. spot Bitcoin ETFs posted $162.8 million in net inflows for the week ending May 1. One single day saw $630 million pour in. Bitcoin’s market dominance rose to 60.73%, meaning capital is rotating from altcoins into BTC.
U.S. Bitcoin spot ETFs pulled in another $532 million on May 4, marking the third straight day of inflows. Ethereum spot ETFs added $61.29 million on the same day.
Institutional money continues to flow in even as on-chain activity remains low; buyers are clearly showing up through the ETF channel rather than directly on-chain.
Geopolitics also changed. Reports of de-escalation in U.S.-Iran tensions and a ceasefire in their 2026 conflict eased fears of a broader energy shock. That reduced a major macro overhang. Risk assets like crypto got a boost.
Miner economics improved. The expected daily return for miners hit $37 per petahash per second, the highest since late January. Better miner profitability reduces selling pressure.
The rally also triggered $270 million in short liquidations. Squeezed shorts added fuel to the fire. All of this happened alongside that $630 million ETF inflow day.
Read also: ChatGPT Predicts Where Bitcoin, XRP, and Solana Will Go If the Clarity Act Passes in May
Bitcoin Price Prediction for Today (May 5)
Bullish scenario
BTC breaks and holds above 83,000 (200 SMA). That opens the door to 89,000 quickly. If volume picks up, $94,000 becomes the next target. This requires continued ETF inflows and a clean daily close above resistance.
Bearish scenario
Price rejects at 83,000 and falls back below 80,000. Support at 77,000 gets tested. A break there leads to 75,000. Thin on-chain activity means fewer buyers to catch a falling knife.
Realistic scenario
Range trading between 80,000 and 83,000 for the next few days. Bulls need a catalyst to break the 200 SMA. Bears need a spike in selling volume. Most likely, price chops sideways until the next ETF inflow report or macro news hits.
FAQs

ETF inflows hit $162.8 million for the week, and U.S.-Iran tensions de-escalated. A $270 million short squeeze also pushed price higher.
Yes, if ETF inflows continue and BTC closes above $83,000. But on-chain activity remains weak, so the move could stall without fresh retail demand.
Bitcoin led the rally on institutional buying and better macro sentiment. Altcoins followed BTC’s move upward.
Subscribe to our YouTube channel for daily crypto updates, market insights, and expert analysis.
The post Bitcoin Price Today: BTC Breaks $81K, But On-Chain Activity Hits 2-Year Lows – Here’s the Data appeared first on CaptainAltcoin.


You May Also Like
Western Union Launches USDPT Stablecoin on Solana — Here’s How It Works

Why Businesses Need Professional Machine Design and Development Services