

Alibaba Stock Presses Resistance as Momentum Cools Near 200-Day EMA

Alibaba Stock retains a constructive medium-term tone, but the setup is no longer cleanly directional. BABA remains in a recovery trend on the daily chart, yet it is now pressing into overhead resistance as near-term momentum begins to cool.
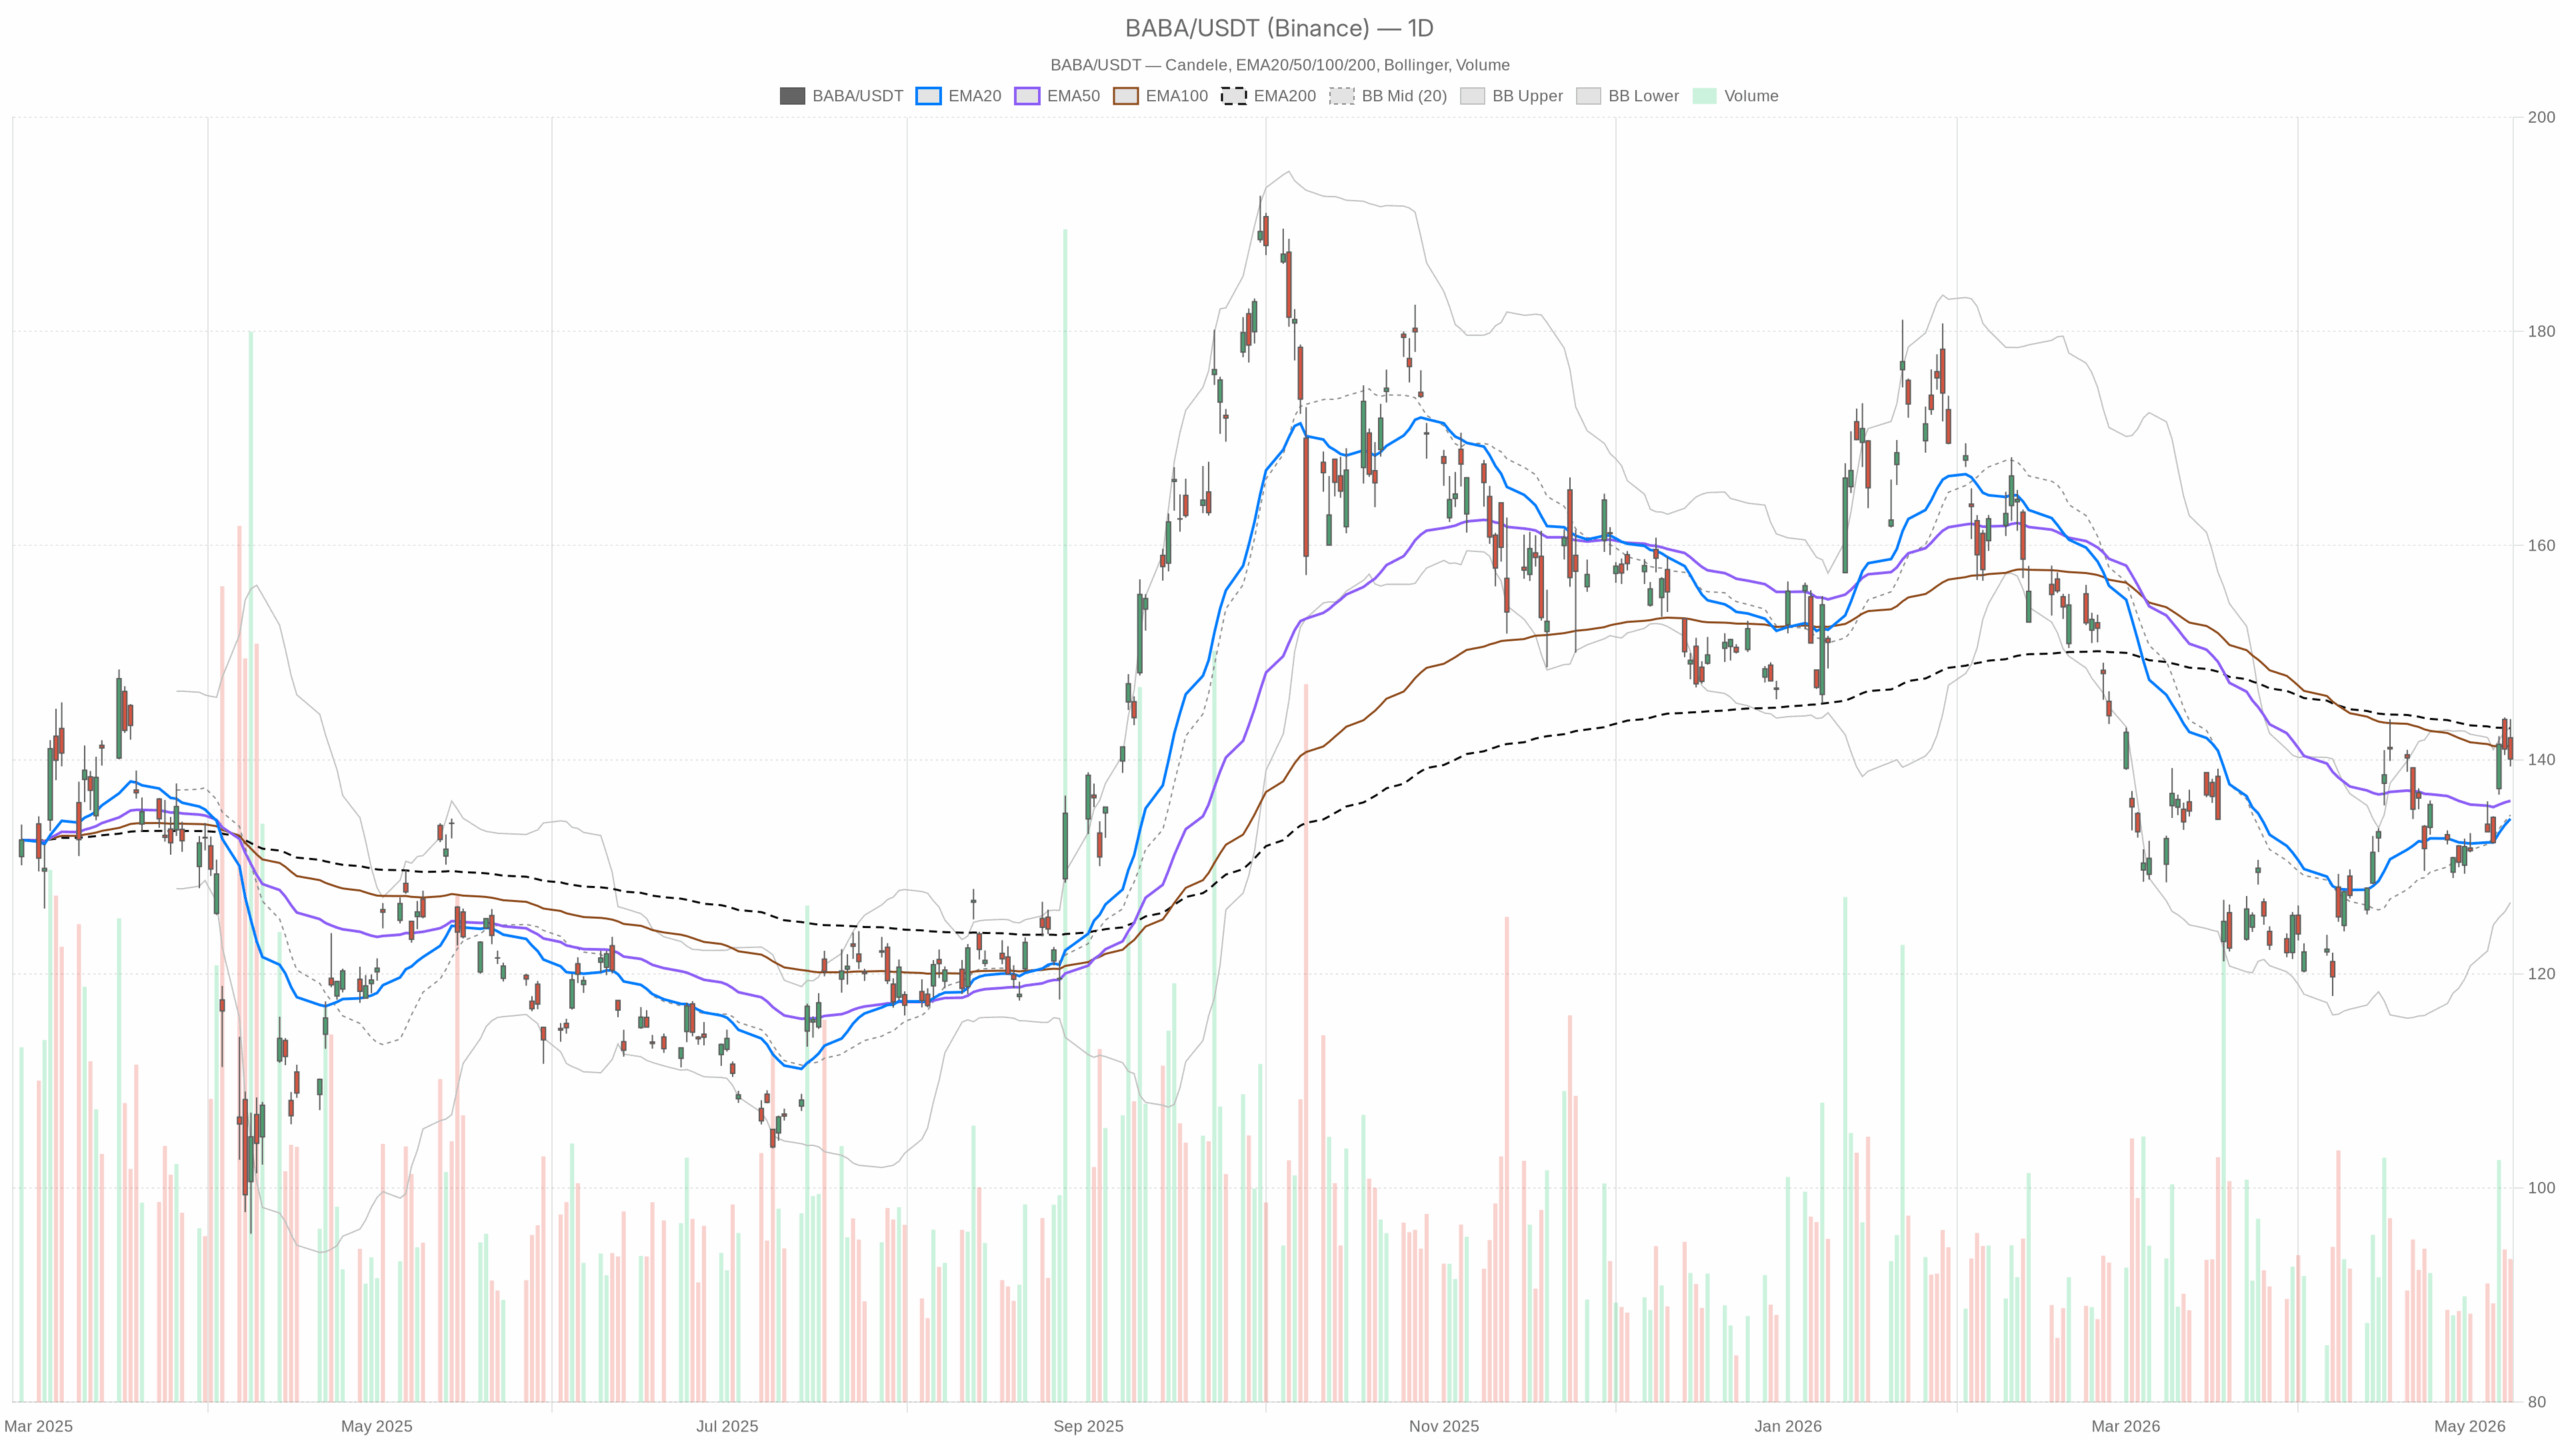 BABA — daily chart with candlesticks, EMA20/EMA50 and volume.
Alibaba Stock daily trend remains constructive
On the daily chart, BABA is still trading above its 20-day and 50-day exponential moving averages. That keeps the broader bias mildly bullish. However, the stock remains below the 200-day EMA and closed just under the upper Bollinger Band after recent strength.
That combination matters. It shows that short- and medium-term trend structure has improved, but the longer-term trend has not fully turned. Notably, the latest close at 140.06 sits above the 20-day EMA at 134.48 and the 50-day EMA at 136.17, while still below the 200-day EMA at 142.94.
Daily RSI at 59.31 supports that view. Momentum is positive without being stretched. Therefore, buyers still have room, but they do not have complete control.
Momentum is positive, but resistance is close
Daily MACD also leans constructive. The MACD line at 1.55 remains above the signal line at 0.57, and the histogram is positive at 0.98. That suggests upside momentum has been building on the higher timeframe.
At the same time, Alibaba Stock is trading near the daily upper Bollinger Band at 143.02. In practical terms, the stock is sitting in the stronger end of its recent range. However, it is also approaching an area where advances often slow unless fresh buying appears.
Volatility and event risk keep BABA sensitive
Volatility on the daily chart remains meaningful rather than extreme. ATR stands at 4.18, which implies BABA can still produce wide daily swings around earnings and headline risk. That is especially important this week.
News flow is supportive in parts, with attention on AI shopping initiatives and robotics. Still, the market is also approaching an earnings catalyst. In addition, the report tied to suspected Nvidia chip smuggling adds a layer of regulatory and geopolitical sensitivity that could disrupt sentiment quickly.
Alibaba Stock hourly chart shows recovery with hesitation
Meanwhile, the one-hour chart confirms the broader recovery, but not without hesitation. BABA is holding above the 20-hour EMA at 139.69, the 50-hour EMA at 137.36, and the 200-hour EMA at 133.74. That keeps the intraday trend structure bullish.
However, hourly MACD has rolled over. The MACD line at 1.12 is now below the signal line at 1.52, and the histogram has turned negative at -0.40. In plain terms, the trend is still up on this timeframe, but momentum has softened and buyers are no longer pressing with the same urgency.
The hourly RSI at 57.06 fits that picture well. It is firm, but not impulsive. At the same time, price is sitting around the hourly pivot at 140.08, with resistance at 140.29 and support at 139.83.
That leaves Alibaba Stock near a short-term balance point. The market is not rejecting higher prices outright. Still, it is also not showing strong follow-through above nearby intraday resistance.
15-minute chart highlights choppy execution
On the 15-minute chart, the message is even more tactical. The stock is effectively flat around its pivot, and the short-term moving averages are tightly clustered. The 20-period EMA stands at 140.27, while the 50-period EMA is at 140.31.
RSI at 44.88 is slightly soft, while MACD is marginally improving from below zero. This is execution context rather than trend definition. Therefore, short-term timing remains choppy, and immediate direction likely depends on whether price can reclaim 140.29 cleanly or slips below 139.83.
Alibaba Stock outlook: neutral-to-bullish, but less decisive
Therefore, the main scenario for Alibaba Stock is neutral-to-bullish, with the daily chart still setting the tone. The recovery from lower levels remains intact, and momentum on the daily timeframe has not broken down.
Still, the stock is pressing into the 200-day EMA and the upper daily Bollinger area, while the hourly MACD shows fading momentum. That conflict matters. It does not reverse the daily bias, but it does reduce the probability of an immediate upside extension without consolidation.
Key bullish and bearish levels for BABA
Bullish scenario
The bullish scenario would strengthen if BABA can hold above the 138.35 daily support zone and then reclaim 142.78, the daily R1 pivot. From there, the market would need enough strength to challenge the 200-day EMA at 142.94.
A sustained move through that area would signal that buyers are absorbing overhead supply. In that case, Alibaba Stock would be shifting from a rebound within a range into a more credible trend continuation.
Bearish scenario
In contrast, the bearish scenario starts to gain traction if Alibaba Stock continues to fail near 142.78 to 142.94 and loses the daily pivot at 141.08 on a closing basis. A break below daily support at 138.35 would be more damaging.
That would suggest the recent advance was unable to convert into a larger breakout. It would also imply that short-term weakness on the hourly chart was an early warning rather than a pause. With daily ATR above 4 points, the downside could unfold quickly if earnings or headlines disappoint.
Alibaba Stock conclusion
Overall, Alibaba Stock is still in recovery mode, but the tape is entering a more decisive area. The daily chart argues for a constructive bias, yet the lower timeframes show momentum fatigue near resistance.
As a result, positioning remains sensitive to earnings and news flow. Volatility is likely to stay elevated, while conviction depends on whether BABA can clear long-term resistance or slips back into consolidation.


You May Also Like

AI predicts XRP price for April 30, 2026

Why Businesses Need Professional Machine Design and Development Services


