-
Ethereum has broken below a key ascending support trendline, while weakening CMF and MACD indicators signal growing bearish momentum.
-
The ETH liquidation map shows massive short positions stacked above current price levels, increasing the probability of heightened volatility.
-
Ethereum is trading near a critical support zone around $2,000, and losing this level could increase the risk of a decline toward the $1,720 region.
Ethereum is facing growing bearish pressure as both technical indicators and derivatives data begin signaling a potential increase in volatility. While the broader crypto market continues to struggle under macroeconomic uncertainty, the ETH price has broken below a crucial ascending support. This has weakened the recovery structure that had been developing since March.
At the same time, the latest Ethereum liquidation map reveals a massive concentration of leveraged short positions stacked above the current price levels. This creates a conflicting but highly important setup where bearish spot-market momentum is colliding with a heavy short-side derivatives imbalance. As a result, traders are now closely watching whether ETH will continue its decline toward lower support levels or trigger a sudden short-squeeze recovery.
Ethereum Liquidation Map Hints at Rising Volatility
The latest Ethereum liquidation map reveals a massive concentration of leveraged short positions stacked above the current price near $2,028. According to the data, the largest short liquidation clusters are positioned between $2,100 and $2,400. This indicates that ETH could witness a sharp volatility spike if bulls reclaim nearby resistance levels.
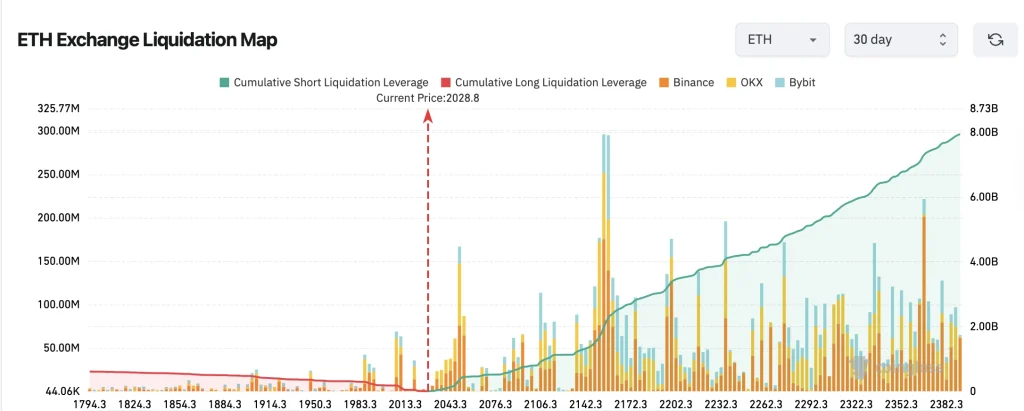
The chart also shows that long liquidation pressure below the current price has weakened considerably. This suggests that most overleveraged bullish positions have already been flushed out during the recent correction. With this, the market is increasingly vulnerable to a potential short squeeze, where forced liquidations of bearish positions could accelerate upward momentum.
The key zones to watch remain around $2,140, $2,200, and $2,350, where liquidation pressure appears strongest.
Ethereum (ETH) Price Analysis
Ethereum is showing increasing weakness after losing the ascending trendline support that had been holding the recovery structure since March. The latest breakdown comes after multiple failed attempts to reclaim the major resistance zone near $2,400. This indicates that buyers are struggling to sustain bullish momentum amid broader market uncertainty.
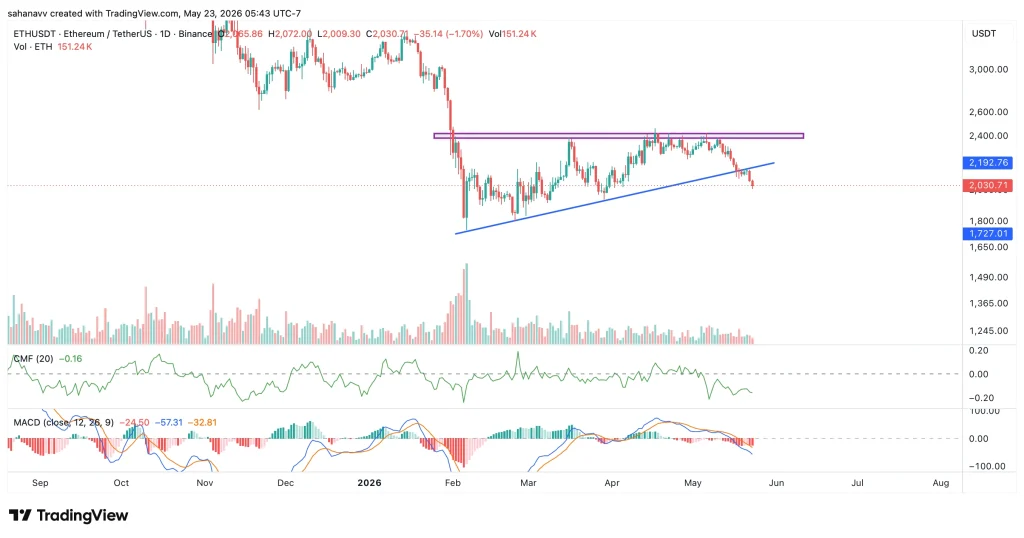
The daily chart suggests ETH is now trading below a critical support region near $2,100 while the Chaikin Money Flow (CMF) has slipped into negative territory. This signals capital outflows and weakening buying pressure. At the same time, the MACD has completed a bearish crossover, further confirming growing downside momentum.
If Ethereum fails to reclaim the broken trendline near $2,190, the price could continue sliding toward the next major support around $1,720. However, a strong recovery above the $2,200–$2,400 resistance region may invalidate the bearish setup and revive bullish sentiment in the short term.
Wrapping it Up—What’s Next for Ethereum Price?
Ethereum continues to trade under bearish pressure after breaking a key ascending support trendline below, while the CMF and MACD indicators suggest weakening momentum. As long as the ETH price remains below the $2,150–$2,200 resistance zone, the possibility of a drop toward $1,720 remains intact.
However, the liquidation map reveals massive short positions stacked above the current price, indicating that a strong move above resistance could trigger a sharp short-squeeze rally in the coming sessions.