

Ethereum price nears crucial support as analysts warn of another leg down
Ethereum price has fallen to around $1,630 after losing roughly 4% in the past 24 hours, while fresh technical signals and market-wide liquidations have kept traders focused on the risk of another move toward key support levels.
- Ethereum price fell about 4% to near $1,630 as crypto liquidations reached $468 million, and Bitcoin dropped below $62,000.
- Analyst Ted Pillows warned that failure to reclaim $1,700 could trigger a move toward the $1,540 support zone.
- Technical indicators remain bearish, with ETH trading below Supertrend resistance near $1,850 and testing long-term support around $1,530.
According to data from crypto.news, Ethereum (ETH) changed hands near $1,628 on June 10, down about 4% over the previous 24 hours. The move coincided with Bitcoin’s (BTC) 4.7% decline to roughly $61,050, which contributed to a 3.5% drop in total crypto market value to around $2.12 trillion. XRP (XRP) also slipped below $1.15, showing that the selloff extended beyond Bitcoin and Ethereum.
Market participants linked the decline to weak risk appetite, security-related concerns, and a wave of leveraged liquidations.
During the selloff, Bitcoin fell from roughly $64,100 to as low as $61,049, with analysts continuing to monitor whether the largest cryptocurrency can maintain support above $60,000. A sustained hold above that level could open the door for a recovery toward $63,400, while a breakdown may expose the $58,000 to $59,000 region.
Liquidations and fund flows increase market pressure
Data from the derivatives market showed that crypto liquidations reached approximately $468 million over the past day. The decline in Bitcoin alone erased about $130 million worth of positions as prices dropped sharply from the $64,100 area.
Liquidation heatmap data cited by market observers showed roughly $331 million in long liquidations and $1.84 billion in short positions remaining vulnerable to a sudden reversal, highlighting the potential for continued volatility if prices change direction quickly.
At the same time, exchange-traded fund activity delivered mixed signals. U.S. spot Bitcoin ETFs recorded net outflows of $91.37 million, while spot Ethereum ETFs attracted $82.37 million in inflows, according to SoSoValue flow data.
Technical indicators point to critical Ethereum support
Commenting on the current market, analyst Ted Pillows said Ethereum has struggled to reclaim the $1,700 level after its latest decline.
According to a chart shared by the analyst, the area acted as a major bottom in February 2026 but has since turned into resistance as sellers continue defending the zone.
Pillows identified the $1,540 area as the next key support level, warning that a failure to recover above $1,700 could expose Ethereum to another move lower.
Additional technical indicators show bearish conditions remain in place. On the daily chart, Ethereum continues to trade below the Supertrend resistance near $1,850, a level that technical traders often monitor for signs of trend reversals.
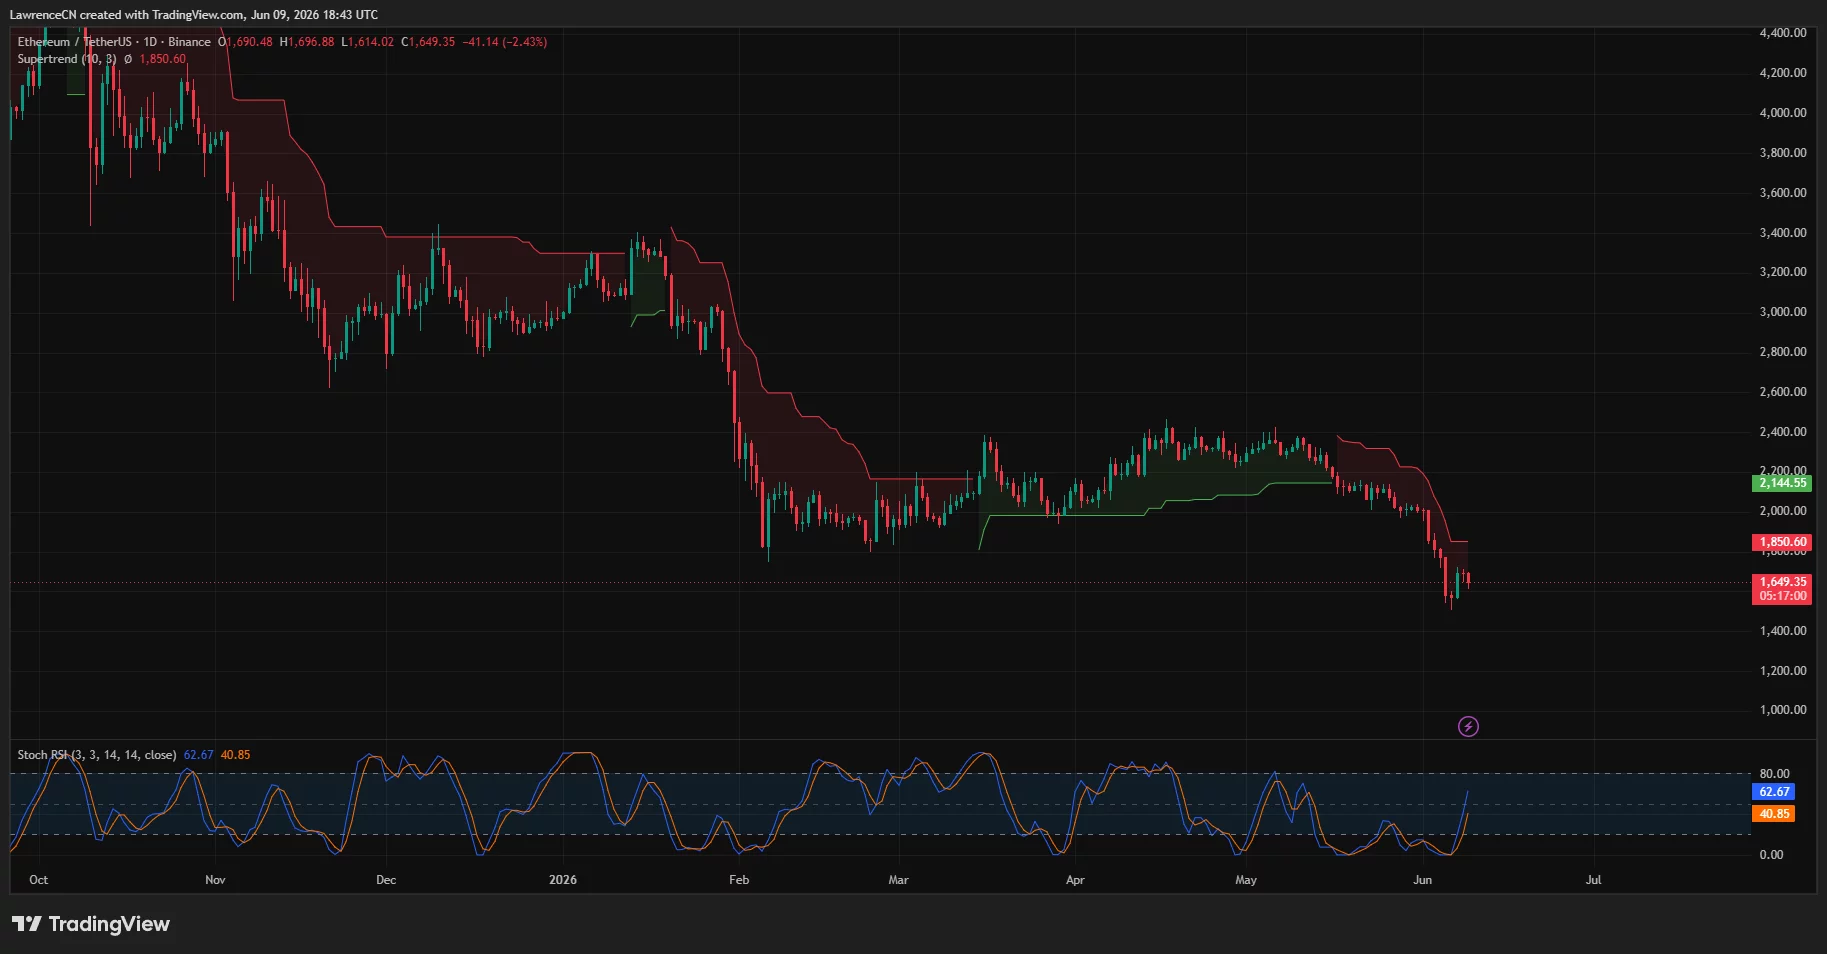
While the Stochastic RSI has rebounded from oversold territory and may support a short-term relief bounce, the indicator has not yet confirmed a broader change in direction.
Longer-term charts point to another important level. Weekly price action shows Ethereum testing support near $1,530, a zone that previously held during major pullbacks in 2023 and 2025.
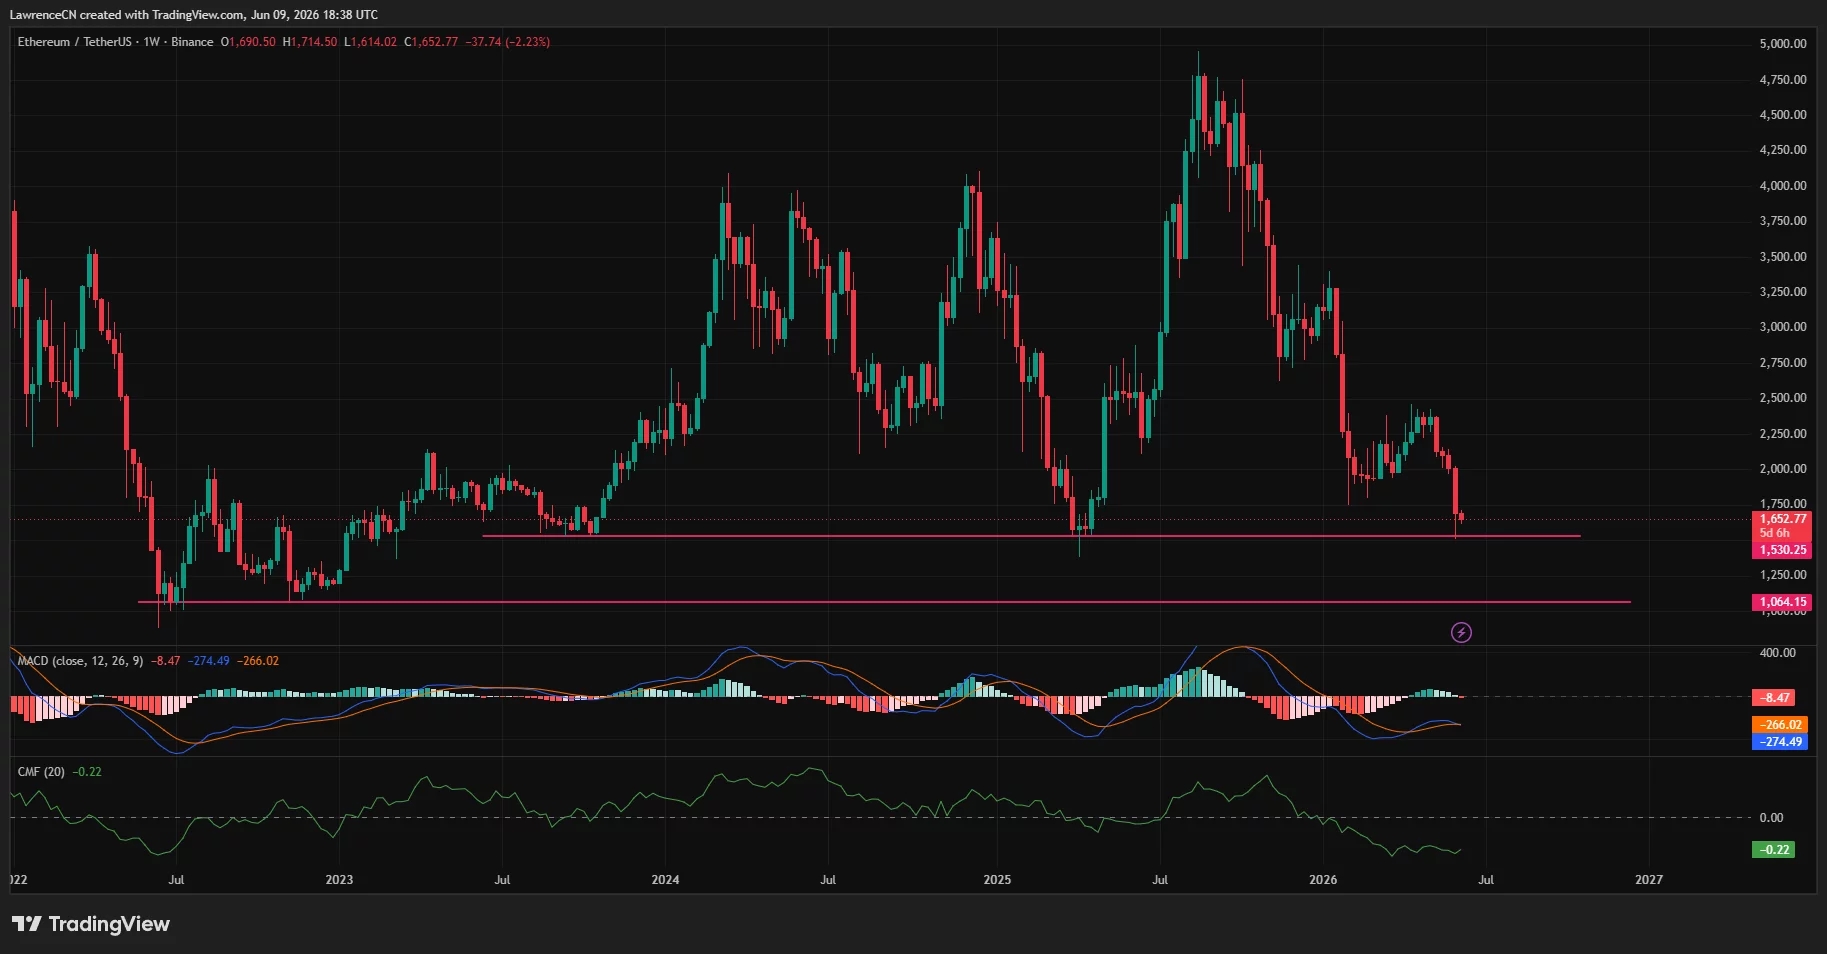
Momentum indicators remain weak, with the weekly MACD staying in bearish territory and the Chaikin Money Flow indicator around negative 0.22, signaling continued capital outflows.
According to the technical setup visible on the weekly chart, a decisive break below $1,530 could expose the next major support level near $1,064.
Any sustained recovery, however, would likely require Ethereum to reclaim resistance levels around $1,700 and eventually move back above the daily Supertrend near $1,850.
Disclosure: This article does not represent investment advice. The content and materials featured on this page are for educational purposes only.


You May Also Like

Vitalik Buterin Proposes Self-Sovereign AI Stack To Protect Users From Risks Of AI Agents

Exasol CTO Mathias Golombek Departs After 22 Years; Company Consolidates Leadership

Washington man gets five years for laundering $97M in fraud proceeds


