

Dogecoin Price Prediction: Analyst Spots DOGE Buy Signal After a 31% Crash
Key highlights:
- The DOGE price is holding key $0.08 support after a 31% correction, with bounce potential growing.
- On-chain activity remains resilient, as active addresses and transfers hold up better than the recent price decline.
- A Tom DeMark buy signal and potential supply changes are giving traders fresh reasons to watch Dogecoin.
Dogecoin has spent the past few weeks under heavy pressure,the price falling almost 31% from around $0.12 to nearly $0.084. For many traders, that kind of move is enough to stay away. Crypto analyst Ali Charts, however, sees something different.
Ali points out that the Tom DeMark Sequential indicator flashed a sell signal on May 7 that correctly came before the entire decline from $0.113 to $0.078. Now the same indicator is printing a buy signal, opening the discussion about whether Dogecoin could be close to finding a bottom.
No technical indicator is perfect, but the combination of oversold conditions, resilient on-chain activity, and key support levels is giving traders plenty to watch.
The DOGE price is holding a critical support zone
We had a look at the 4-hour and daily DOGE charts, and one thing stands out immediately: buyers keep showing up around the $0.08 area. Since the decline of more than 31% off its previous peaks, the DOGE price has been trading near the $0.0845-$0.0850 price range after finding itself at a level of strong technical support.
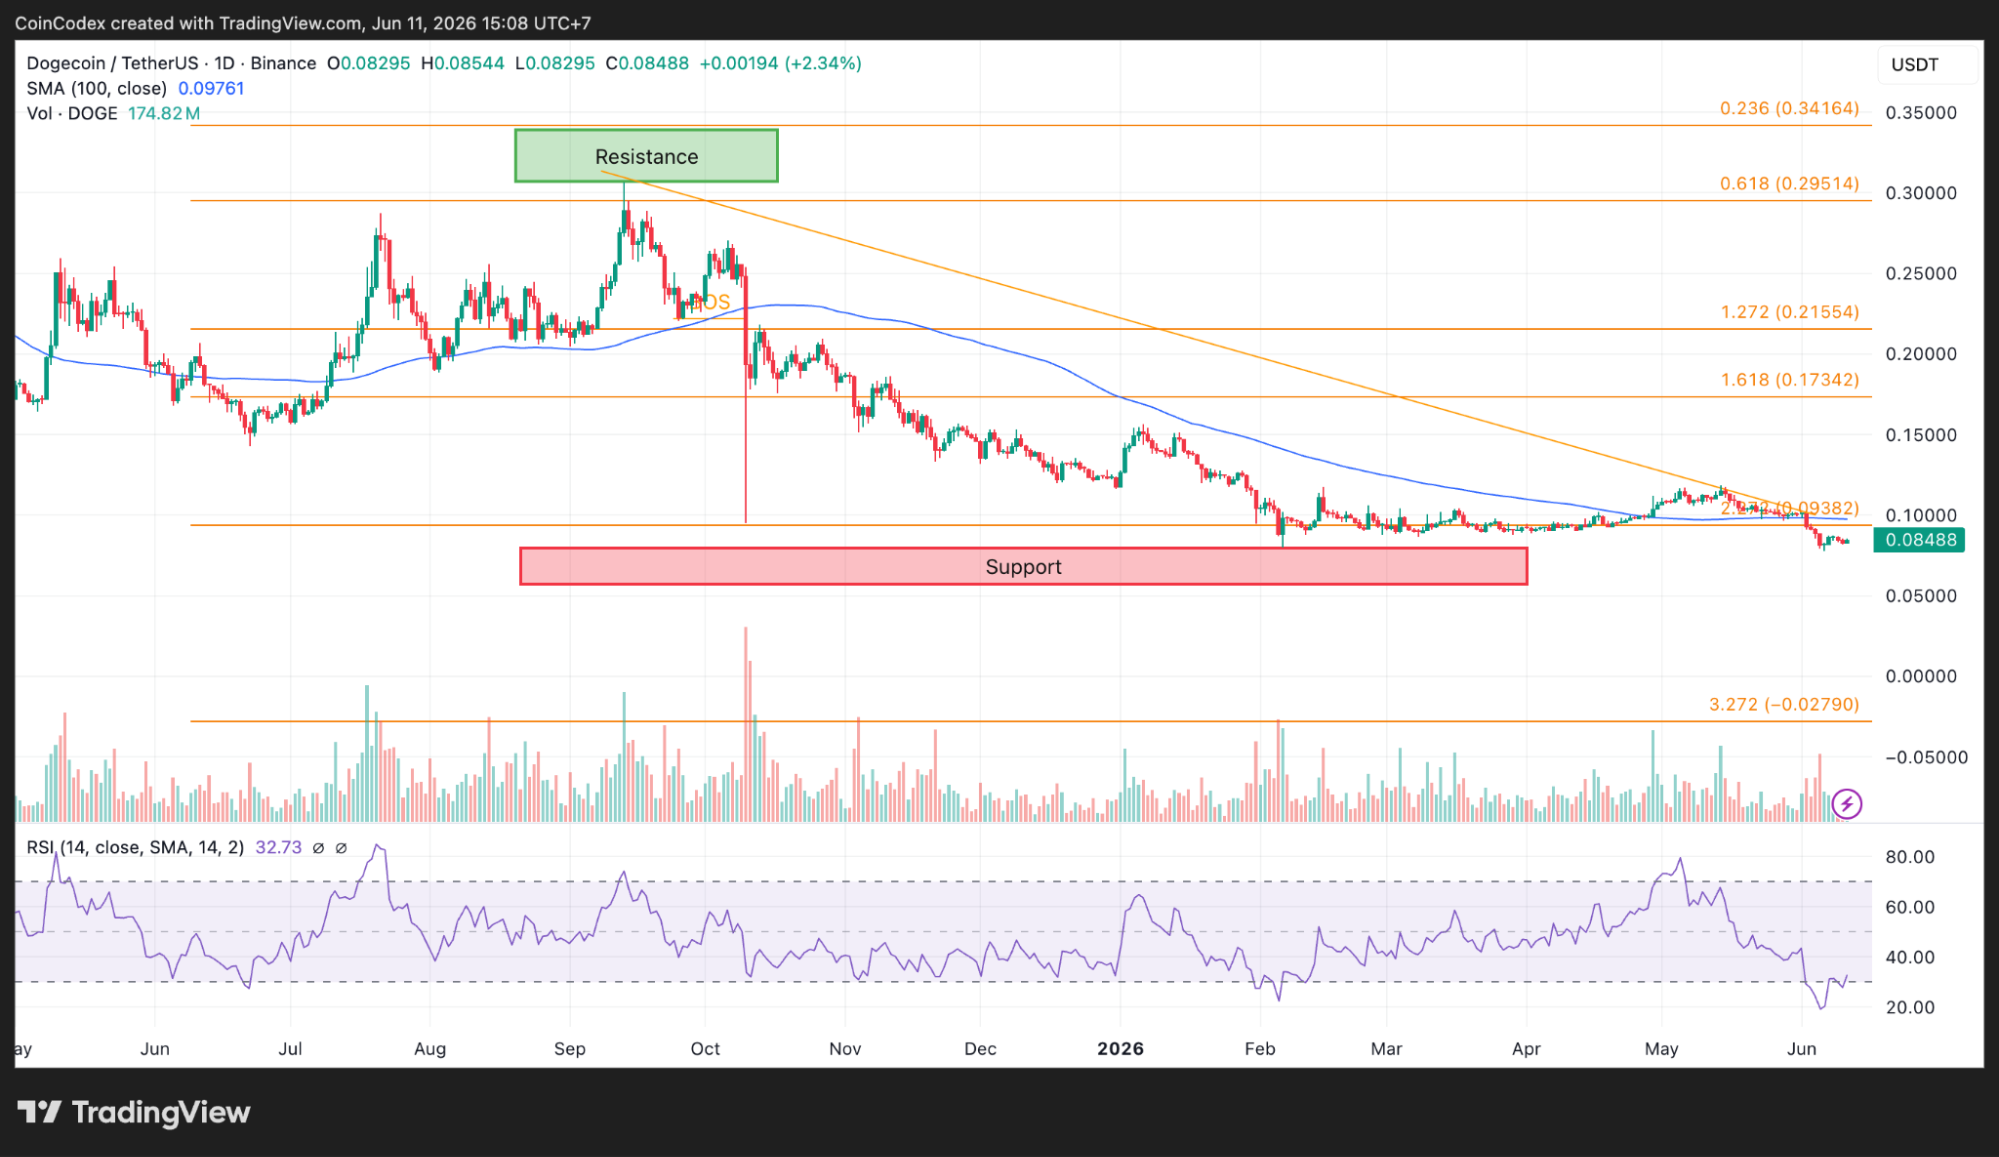
Daily DOGE chart analysis
While the daily chart does not show much potential for a reversal yet, the token continues to be stuck within the downward channel that has pushed prices down since late 2025 while still trading below the 100-day SMA line of $0.0976. Additionally, the daily RSI index stands near 32.7, which implies that the token is approaching the level of oversold, from where relief rallies are usually initiated.
However, the 4-hour chart is a bit more bullish in nature. The DOGE price has already started showing signs of a reversal and now trades sideways between the $0.078-$0.082 support levels and the $0.09-$0.10 resistance zone.
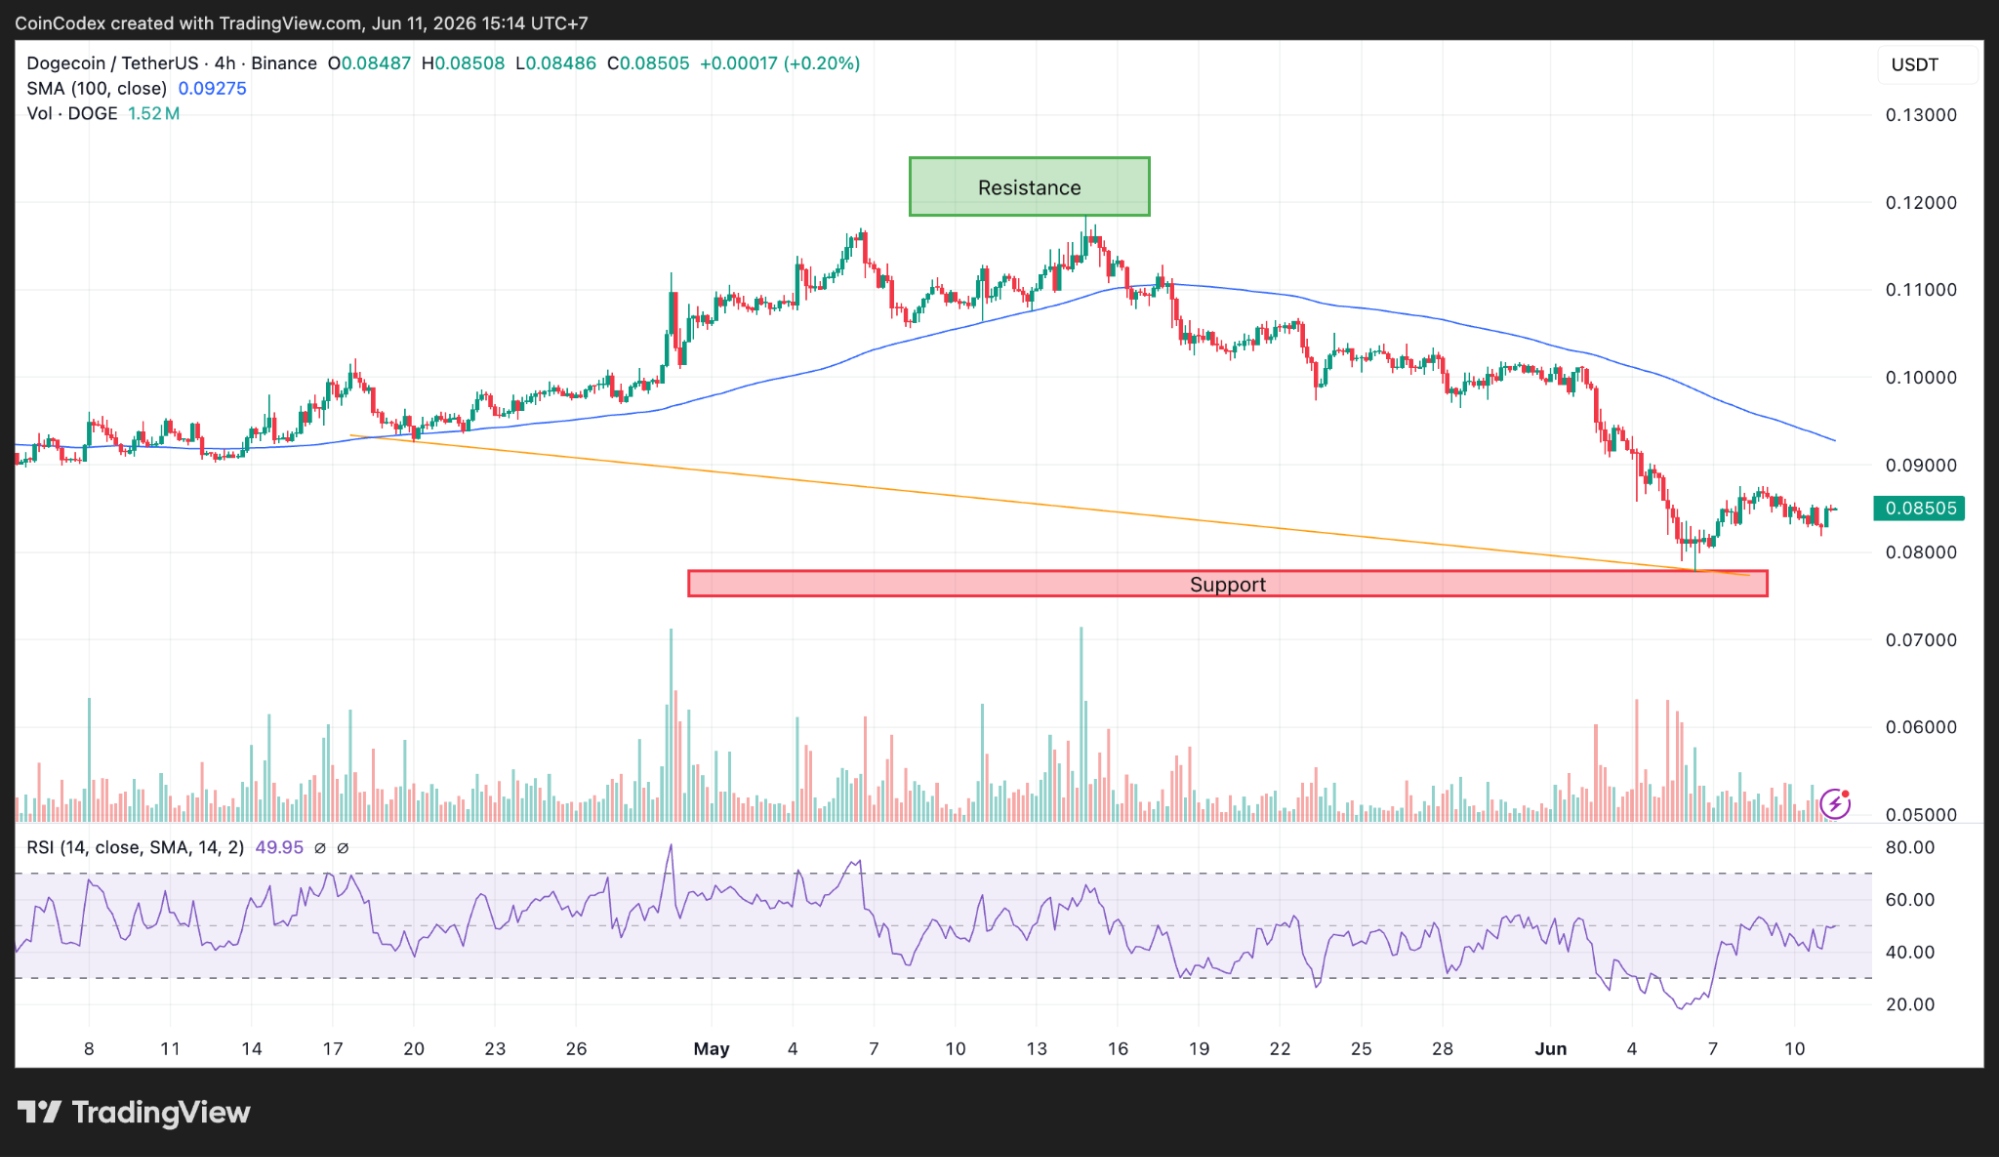
4-hour DOGE chart analysis
The 100 SMA continues to hover near $0.0928, which means that buyers still face a barrier. However, the 4-hour RSI already returned closer to 50, meaning that there has been less selling interest since the early days of the month.
At the moment, the significant pivot points are obvious. Should the DOGE price push above $0.092 followed by breaking above $0.10, then the recovery will probably take the coin up towards the $0.12-$0.13 level. On the other hand, if buyers fail to hold above the level of $0.08, then the price will probably drop to $0.076 and perhaps $0.07.
On-chain activity is stronger than the price suggests
Price action tells only part of the story. The blockchain itself is painting a slightly different picture. The number of daily active addresses went back up to nearly 36,000 despite falling to near 33,000 during the price drop.
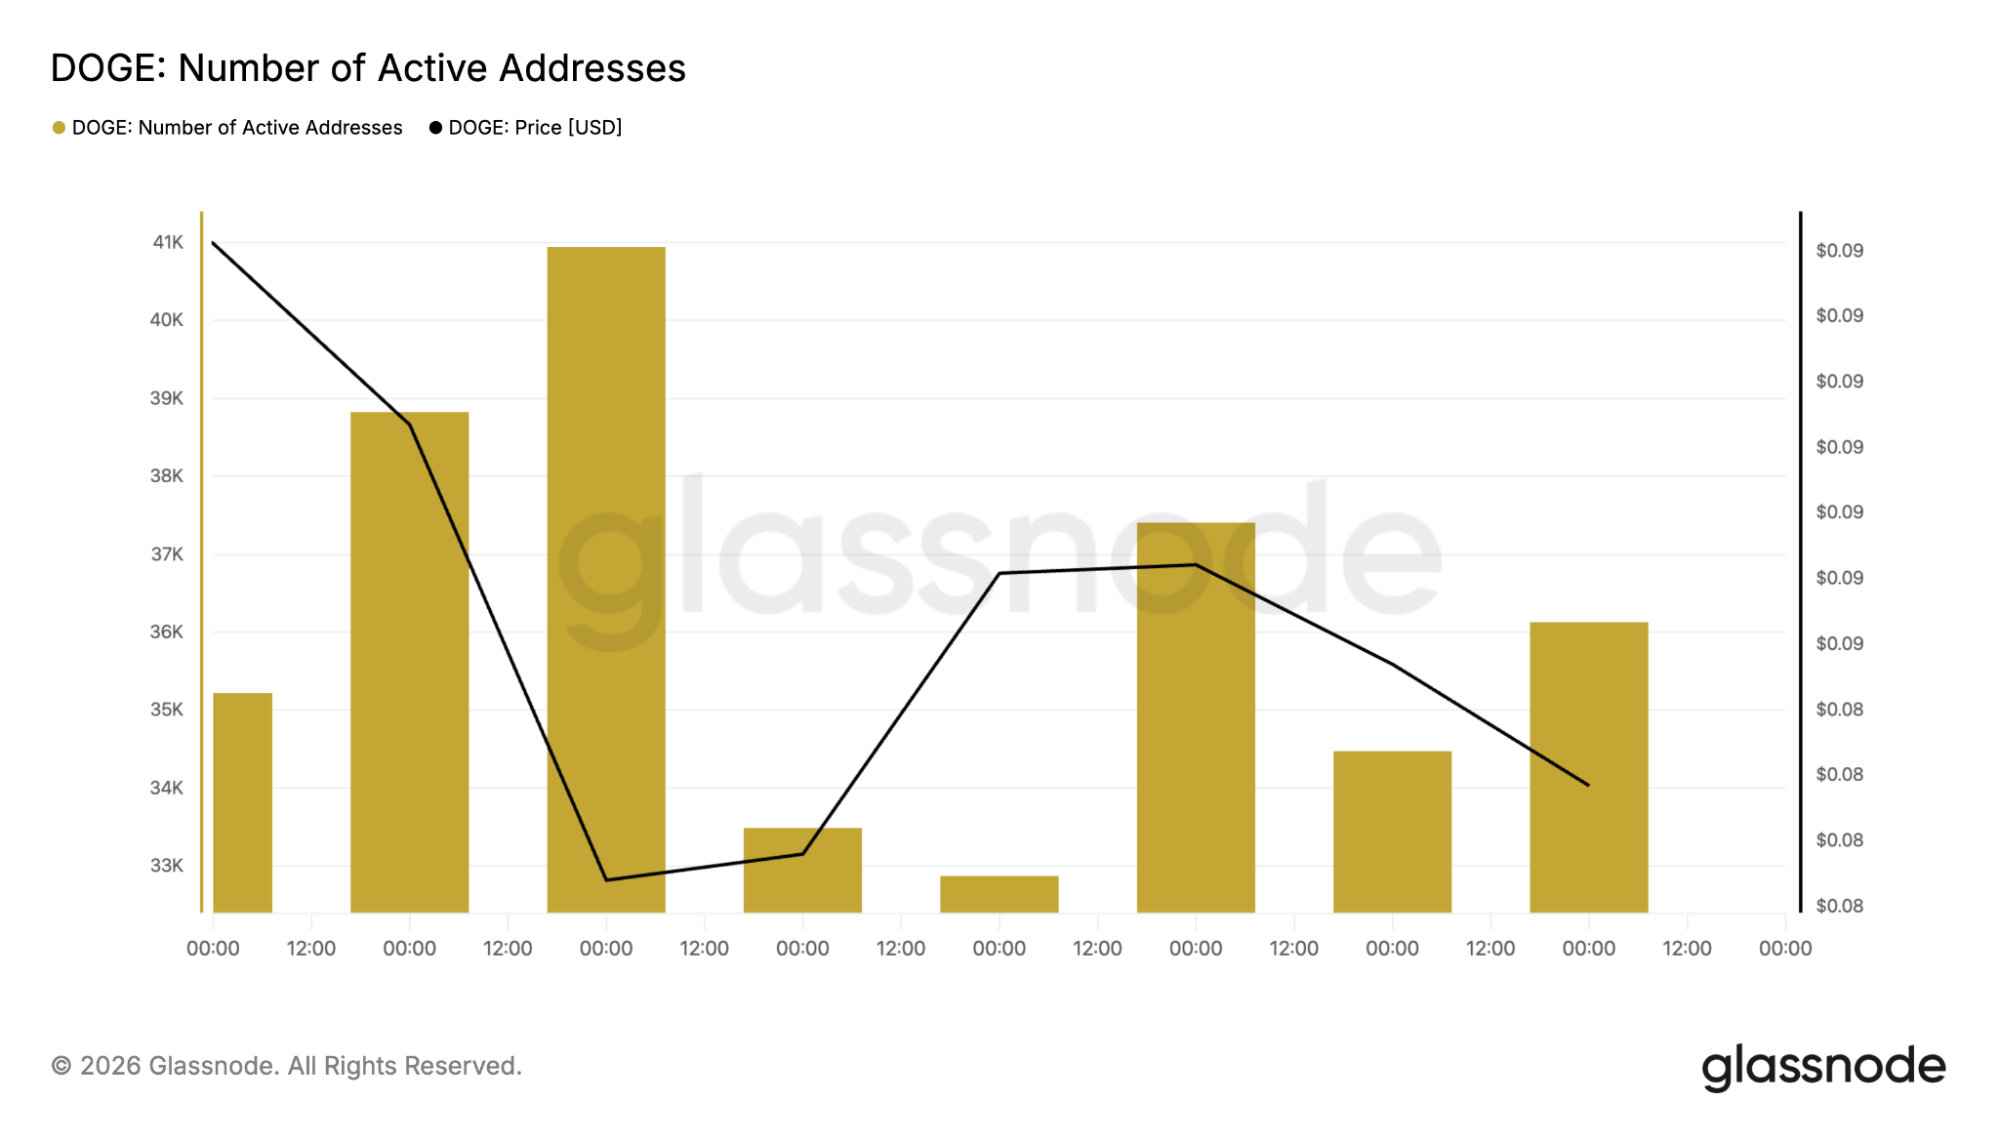
Before, the maximum was close to 41,000 addresses, meaning there is a huge difference between usage on the network and price action. The same trend holds for transactions, which fell from nearly 60,000 daily to between 45,000 and 46,000.
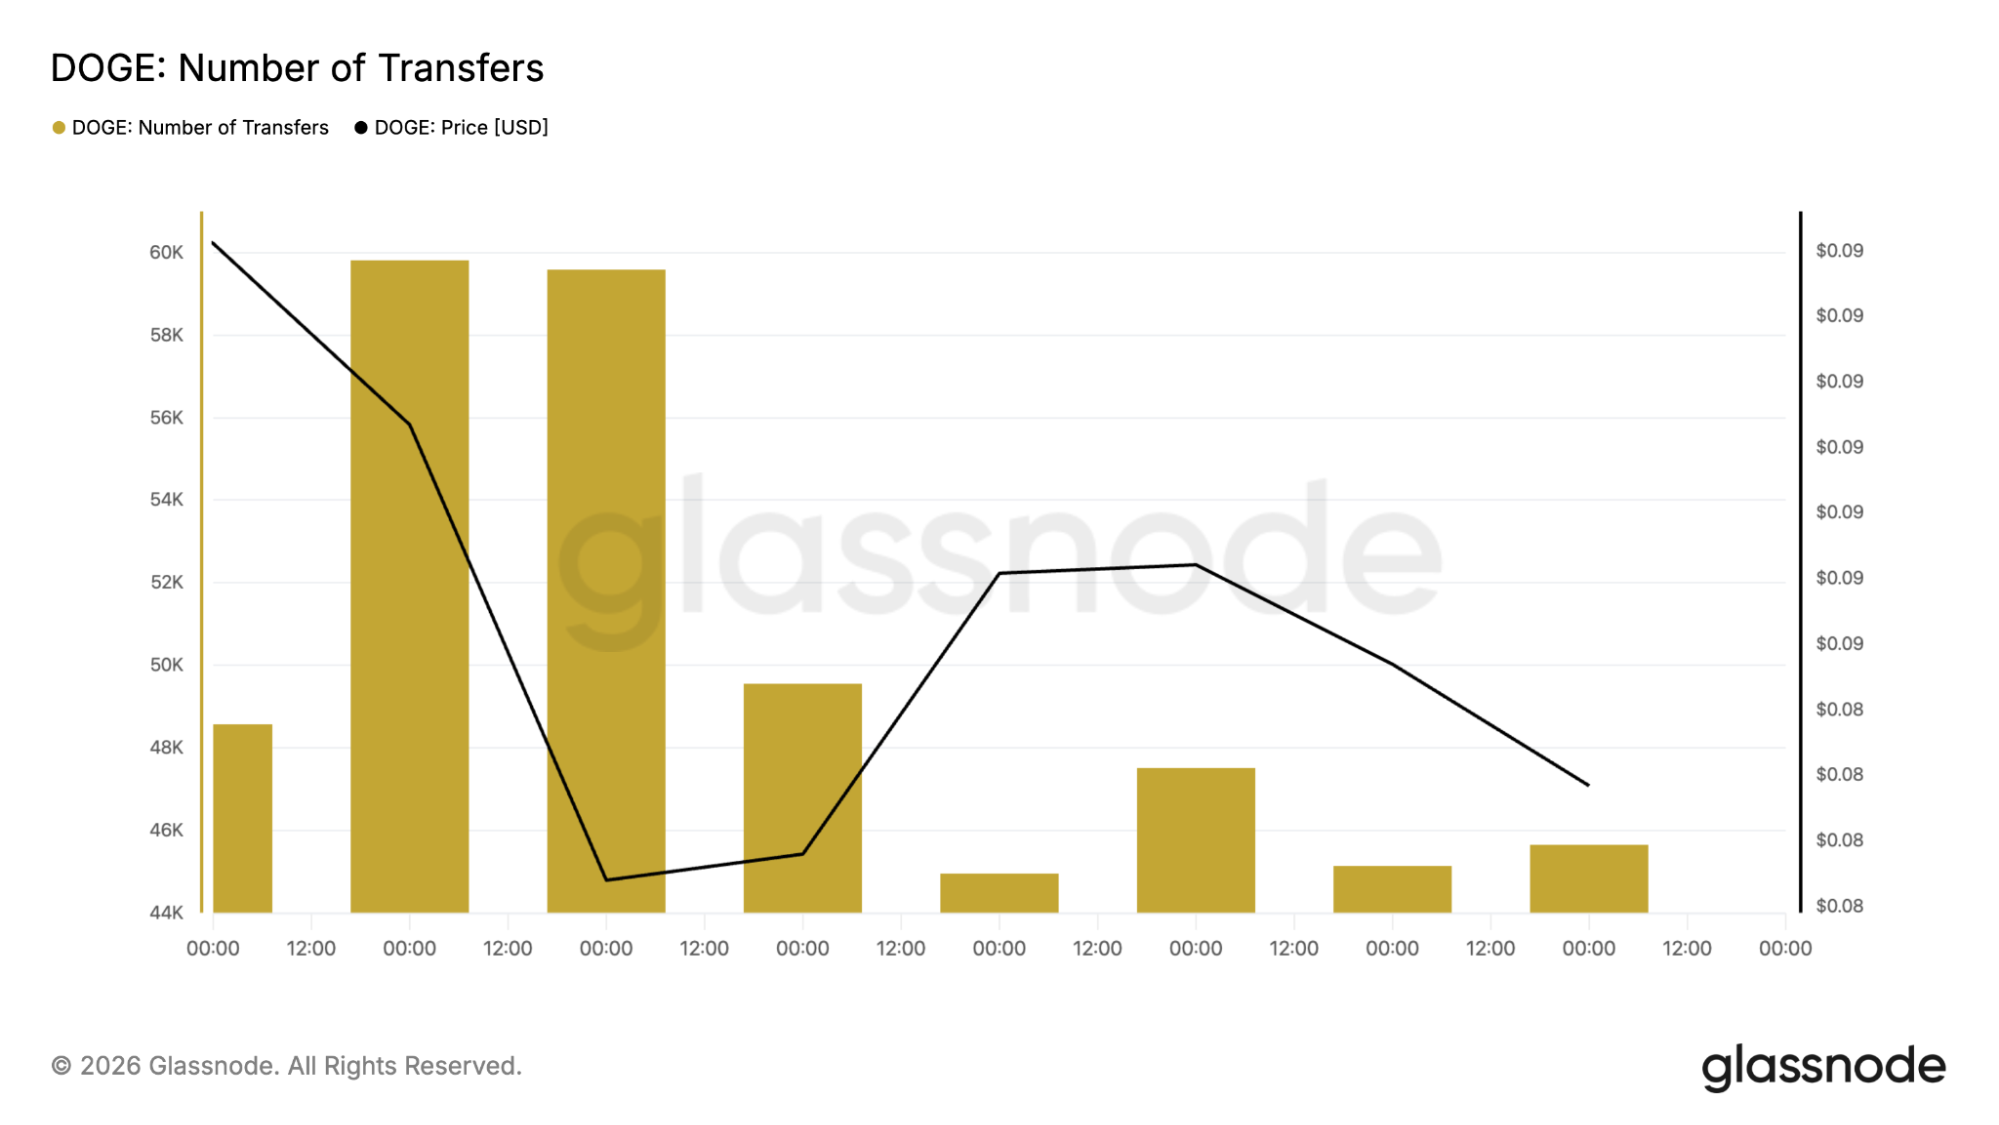
This is important, as bottoming out happens when usage remains solid while the price is low. It points to holders continuing to use and accumulate the asset instead of abandoning it entirely. The 3-day chart also shows a possible stabilization phase after the nearly 31% decline, matching the fresh Tom DeMark buy signal that Ali Charts identified.
New catalysts could change the DOGE price outlook
The technical picture isn't the only thing attracting attention. One proposal being discussed within the Dogecoin community could reduce the block reward from 10,000 DOGE to 1,000 DOGE, cutting annual issuance from roughly 5 billion coins to approximately 500 million.
If adopted through community consensus and a hard fork, Dogecoin's inflation rate would fall dramatically, reducing the constant supply entering the market. Whale activity also points to continued interest. Large holders accumulated more than 200 million DOGE over the past week, indicating that some investors are increasing exposure even after the correction.
There are also broader catalysts that could improve sentiment. Proposed U.S. digital asset legislation may provide clearer regulatory treatment for cryptocurrencies such as Dogecoin, and speculation continues around potential DOGE payment functionality within X. Neither development is guaranteed, but both remain themes closely followed by the market.
What comes next for the DOGE price?
The DOGE price is at an interesting point where technicals and on-chain data are beginning to align. Support around $0.08 continues to hold, daily active addresses remain close to 36,000, transaction counts have stabilized near 45,000–46,000, and the daily RSI is sitting near oversold levels.
None of those factors confirm a reversal, but together they create a more balanced picture than price alone would indicate. This next move is easy. Buyers must get back their $0.092 and move past the significant $0.10 mark. Otherwise, volatility will continue, and the trend will stay bearish.
Dogecoin traders can look forward to the following days when they will find out if it was just a temporary pullback in an ongoing downward trend or the start of a comeback from one of its biggest declines this year.
CoinCodex’s 1-month DOGE price prediction places the price at $0.09830, which is above current trading levels and indicates that analysts expect the DOGE price to recover modestly if buyers continue defending key support and reclaim nearby resistance levels.


You May Also Like

LIST: Bayanihan initiatives amid soaring oil prices

Crypto Hack: Drift Protocol Drained Over $200M in Private Key Breach

Metaplanet Stock Passes MARA to Become Third-Largest BTC Holder — Stock Slips Anyway


