

Crypto Price Prediction for Today, June 26: Ethereum (ETH), XRP, and Solana (SOL)
Ethereum, XRP, and Solana have all started today’s session near important technical levels, although each coin is following a different path. Ethereum price has returned to a major support zone after several days of losses.
XRP price has slipped to another fresh low, and Solana price is attempting to recover after defending a key support level. Technical indicators now provide useful clues about what could happen before today’s trading session comes to an end.
Ethereum Price Tests Critical $1,500 Support as Sellers Stay in Control
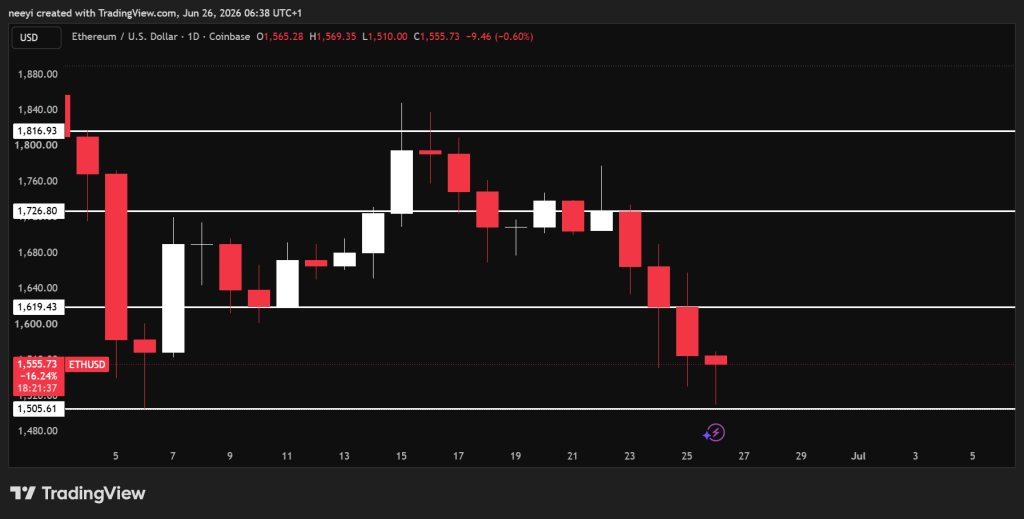
Ethereum price has now recorded 4 consecutive red daily candles and dropped back to around $1,500. That support has held several times before, although repeated tests usually weaken its strength. Today’s price action could therefore decide whether ETH extends its decline or begins to stabilize.
A break below $1,500 would strengthen the bearish outlook and increase the chances of another move lower before the day closes. Recovery remains possible if Ethereum price climbs above $1,619. That move would reduce bearish pressure and could allow ETH to trade between $1,619 and $1,730 for the rest of today. A move above $1,730 would shift the outlook into bullish territory, although that currently appears to be the least likely scenario.
 ETH Price Chart / TradingView.com
The Relative Strength Index currently stands at 32.3. That reading shows Ethereum price is approaching oversold territory after several days of selling, although it has not reached an extreme level where reversals often begin.
Stochastic %K has dropped to 24.1. That shows buying activity remains weak and sellers continue to dominate short term price action. The Commodity Channel Index sits at negative 123.6. Such deeply negative readings often appear after heavy selling and can sometimes point to a temporary rebound if buyers step back into the market.
The Average Directional Index has climbed to 38.1. That indicates the current trend remains strong. Since Ethereum price continues moving lower, sellers still hold the advantage. The Awesome Oscillator remains below zero at negative 110.3. That confirms bearish momentum still dominates despite ETH trading close to an important support level.
| Name Of Indicator | Metric | Interpretation Of Reading |
|---|---|---|
| Relative Strength Index (14) | 32.3 | Near oversold after several days of selling |
| Stochastic %K | 24.1 | Buying pressure remains weak |
| Commodity Channel Index | -123.6 | Heavy selling could soon begin slowing |
| Average Directional Index | 38.1 | Current bearish trend remains strong |
| Awesome Oscillator | -110.3 | Bearish momentum still dominates |
Ethereum (ETH) Price Prediction For Today
Bullish Scenario: Ethereum price breaks above $1,730 and opens the door for stronger buying.
Neutral Scenario: ETH climbs above $1,619 and trades between $1,619 and $1,730 for the remainder of today’s session.
Bearish Scenario: Ethereum price loses the $1,500 support level and extends the current decline.
XRP Price Forms Another Daily Low as Bears Defend Control
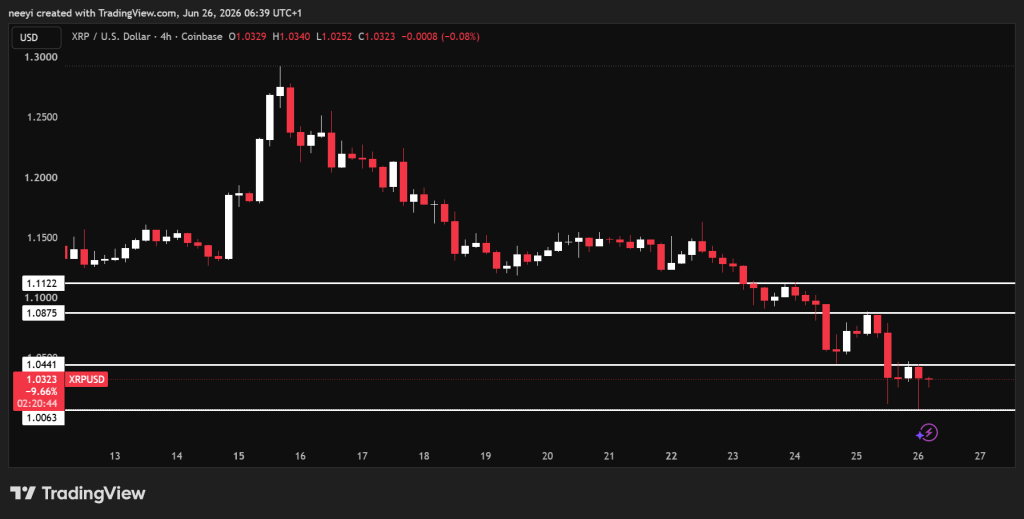
XRP price formed another daily low near $1.00 before recovering slightly toward $1.03. The continued series of lower lows shows sellers still control the short term direction.
A move above $1.04 would reduce bearish pressure and could allow XRP price to trade between $1.04 and $1.08 for the rest of today. Stronger recovery would require a break above $1.08. That move could send Ripple toward $1.10 before today’s close, although current market conditions make that the least likely outcome.
 XRP Price Chart / TradingView.com
The Relative Strength Index has dropped to 29.01. XRP has now entered oversold territory after several days of sustained selling. Stochastic %K stands at 25.00. Buying activity remains weak despite today’s small rebound from the daily low.
The Commodity Channel Index has fallen to negative 122.72. That shows selling pressure has become extreme and could begin easing if buyers return.
The Average Directional Index stands at 38.61. The existing bearish trend remains strong and continues to favor sellers. The Awesome Oscillator remains below zero at negative 0.0688. Downward momentum still dominates despite the modest recovery from today’s low.
| Name Of Indicator | Metric | Interpretation Of Reading |
|---|---|---|
| Relative Strength Index (14) | 29.01 | Oversold conditions are developing |
| Stochastic %K | 25.00 | Buying pressure remains weak |
| Commodity Channel Index | -122.72 | Heavy selling may soon begin easing |
| Average Directional Index | 38.61 | Current bearish trend remains strong |
| Awesome Oscillator | -0.0688 | Bearish momentum continues |
XRP Price Prediction For Today
Bullish Scenario: XRP price breaks above $1.08 and moves toward $1.10.
Neutral Scenario: Ripple climbs above $1.04 and trades between $1.04 and $1.08 through today’s session.
Bearish Scenario: XRP price falls below the $1.00 support level and extends the current decline.
Solana Price Attempts Recovery After Holding Above Key Support
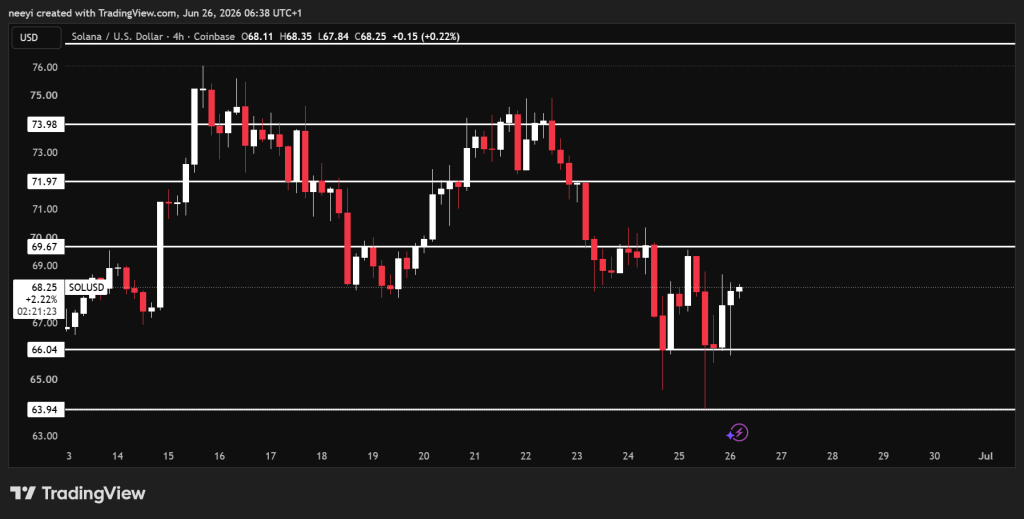
Solana price has shown better stability than Ethereum and XRP during the past day. SOL bounced from around $63.90 yesterday before recovering above $66. Buyers have since pushed the price close to $67.
Failure to hold $66 could send Solana price back toward the $63 area before today’s session ends. Stable trading between $66 and $69 remains possible if neither buyers nor sellers establish clear control. A move above $69 would improve the outlook and could allow SOL price to climb toward $72.
 SOL Price Chart / TradingView.com
The Relative Strength Index currently stands at 40.99. That reading shows selling pressure has eased, although buyers have not fully regained control. Stochastic %K sits at 34.28. Buying activity has improved slightly, although stronger demand is still needed to support a larger recovery.
The Commodity Channel Index has recovered to negative 40.69. That shows selling pressure has eased considerably compared with Ethereum and XRP.
The Average Directional Index stands at 27.48. The existing trend remains weaker than the trends currently affecting Ethereum price and XRP price. The Awesome Oscillator remains below zero at negative 3.87. Bearish momentum still exists, although recent price action points to improving conditions.
| Name Of Indicator | Metric | Interpretation Of Reading |
|---|---|---|
| Relative Strength Index (14) | 40.99 | Selling pressure has eased |
| Stochastic %K | 34.28 | Buying activity is gradually improving |
| Commodity Channel Index | -40.69 | Selling pressure has moderated |
| Average Directional Index | 27.48 | Trend strength remains relatively modest |
| Awesome Oscillator | -3.87 | Bearish momentum is weakening |
Solana (SOL) Price Prediction For Today
Bullish Scenario: SOL price breaks above $69 and climbs toward $72.
Neutral Scenario: Solana price trades between $66 and $69 for the rest of today’s session.
Bearish Scenario: SOL price falls below $66 and drops back toward the $63 support area.
FAQs
Subscribe to our YouTube channel for daily crypto updates, market insights, and expert analysis.
The post Crypto Price Prediction for Today, June 26: Ethereum (ETH), XRP, and Solana (SOL) appeared first on CaptainAltcoin.


You May Also Like

Iran’s foreign minister targeted in assassination attempt, wife killed

Justice Department has 'gone off the rails' for Trump's 'pretzel logic': analysis

Pi Network Faces Centralization Debate as Community Questions Pi2Day Direction


Trending News
More24/7 Live News
MoreQuick Reads
More
