

Marvell Sank This Week Even as It Joined the S&P 500. Could the Pullback Be the Opening?
Key Stats for Marvell Stock
- Current Price: $266.77
- Target Price (Mid): ~$820
- Street Target: ~$245
- Potential Total Return: ~208%
- Annualized IRR: ~28% / year
- Earnings Reaction: +3.09% (May 27, 2026)
- Max Drawdown: 26.42% (February 4, 2026)
Now Live: Discover how much upside your favorite stocks could have using TIKR’s new Valuation Model (It’s free) >>>
What Happened?
Marvell Technology (MRVL) just lived through the strangest kind of bad week: the one that arrives right after a victory lap. The stock entered the S&P 500 before the open on Monday, June 22, the formal stamp that a company has reached the scale and importance of the largest names in the market. By Friday, it closed at $266.77, down 5.15% on the day and well off its $329.88 fifty-two-week high. The index got its newest AI chipmaker. The chipmaker got a selloff.
That whiplash is the whole argument over Marvell stock in 2026. One camp sees a business lapping its own analysts, with a model card that points to far higher prices. The other sees a roughly $233 billion company priced for a future that has to arrive exactly on schedule, trading above where Wall Street’s average target sits today. The question the market cannot yet answer is whether an accelerating story can hold a stock this richly valued once the easy catalysts are spent.
What Actually Knocked the Stock Down
The proximate trigger was not a guidance cut or a lost customer. It was a filing. Outgoing chief financial officer Willem Meintjes filed a Form 144 disclosing plans to sell 211,329 shares, worth roughly $65 million at the stock’s mid-June price. A Form 144 is only a notice of intent to sell, not a completed trade, but traders rarely wait for the distinction. Large insider sales near a high, especially from the finance chief, get read as a signal about valuation, and the selling snowballed across a broad chip pullback.
The context softens the panic. Meintjes is retiring after 10 years, not bailing. On June 11, Marvell named Dan Durn, formerly of Adobe, as CFO effective June 15, with Meintjes staying on as an adviser through April 2027. Durn spent most of his career as a semiconductor finance leader, with prior CFO roles at GlobalFoundries, NXP, and Applied Materials, and the company reaffirmed its second-quarter outlook alongside the news.
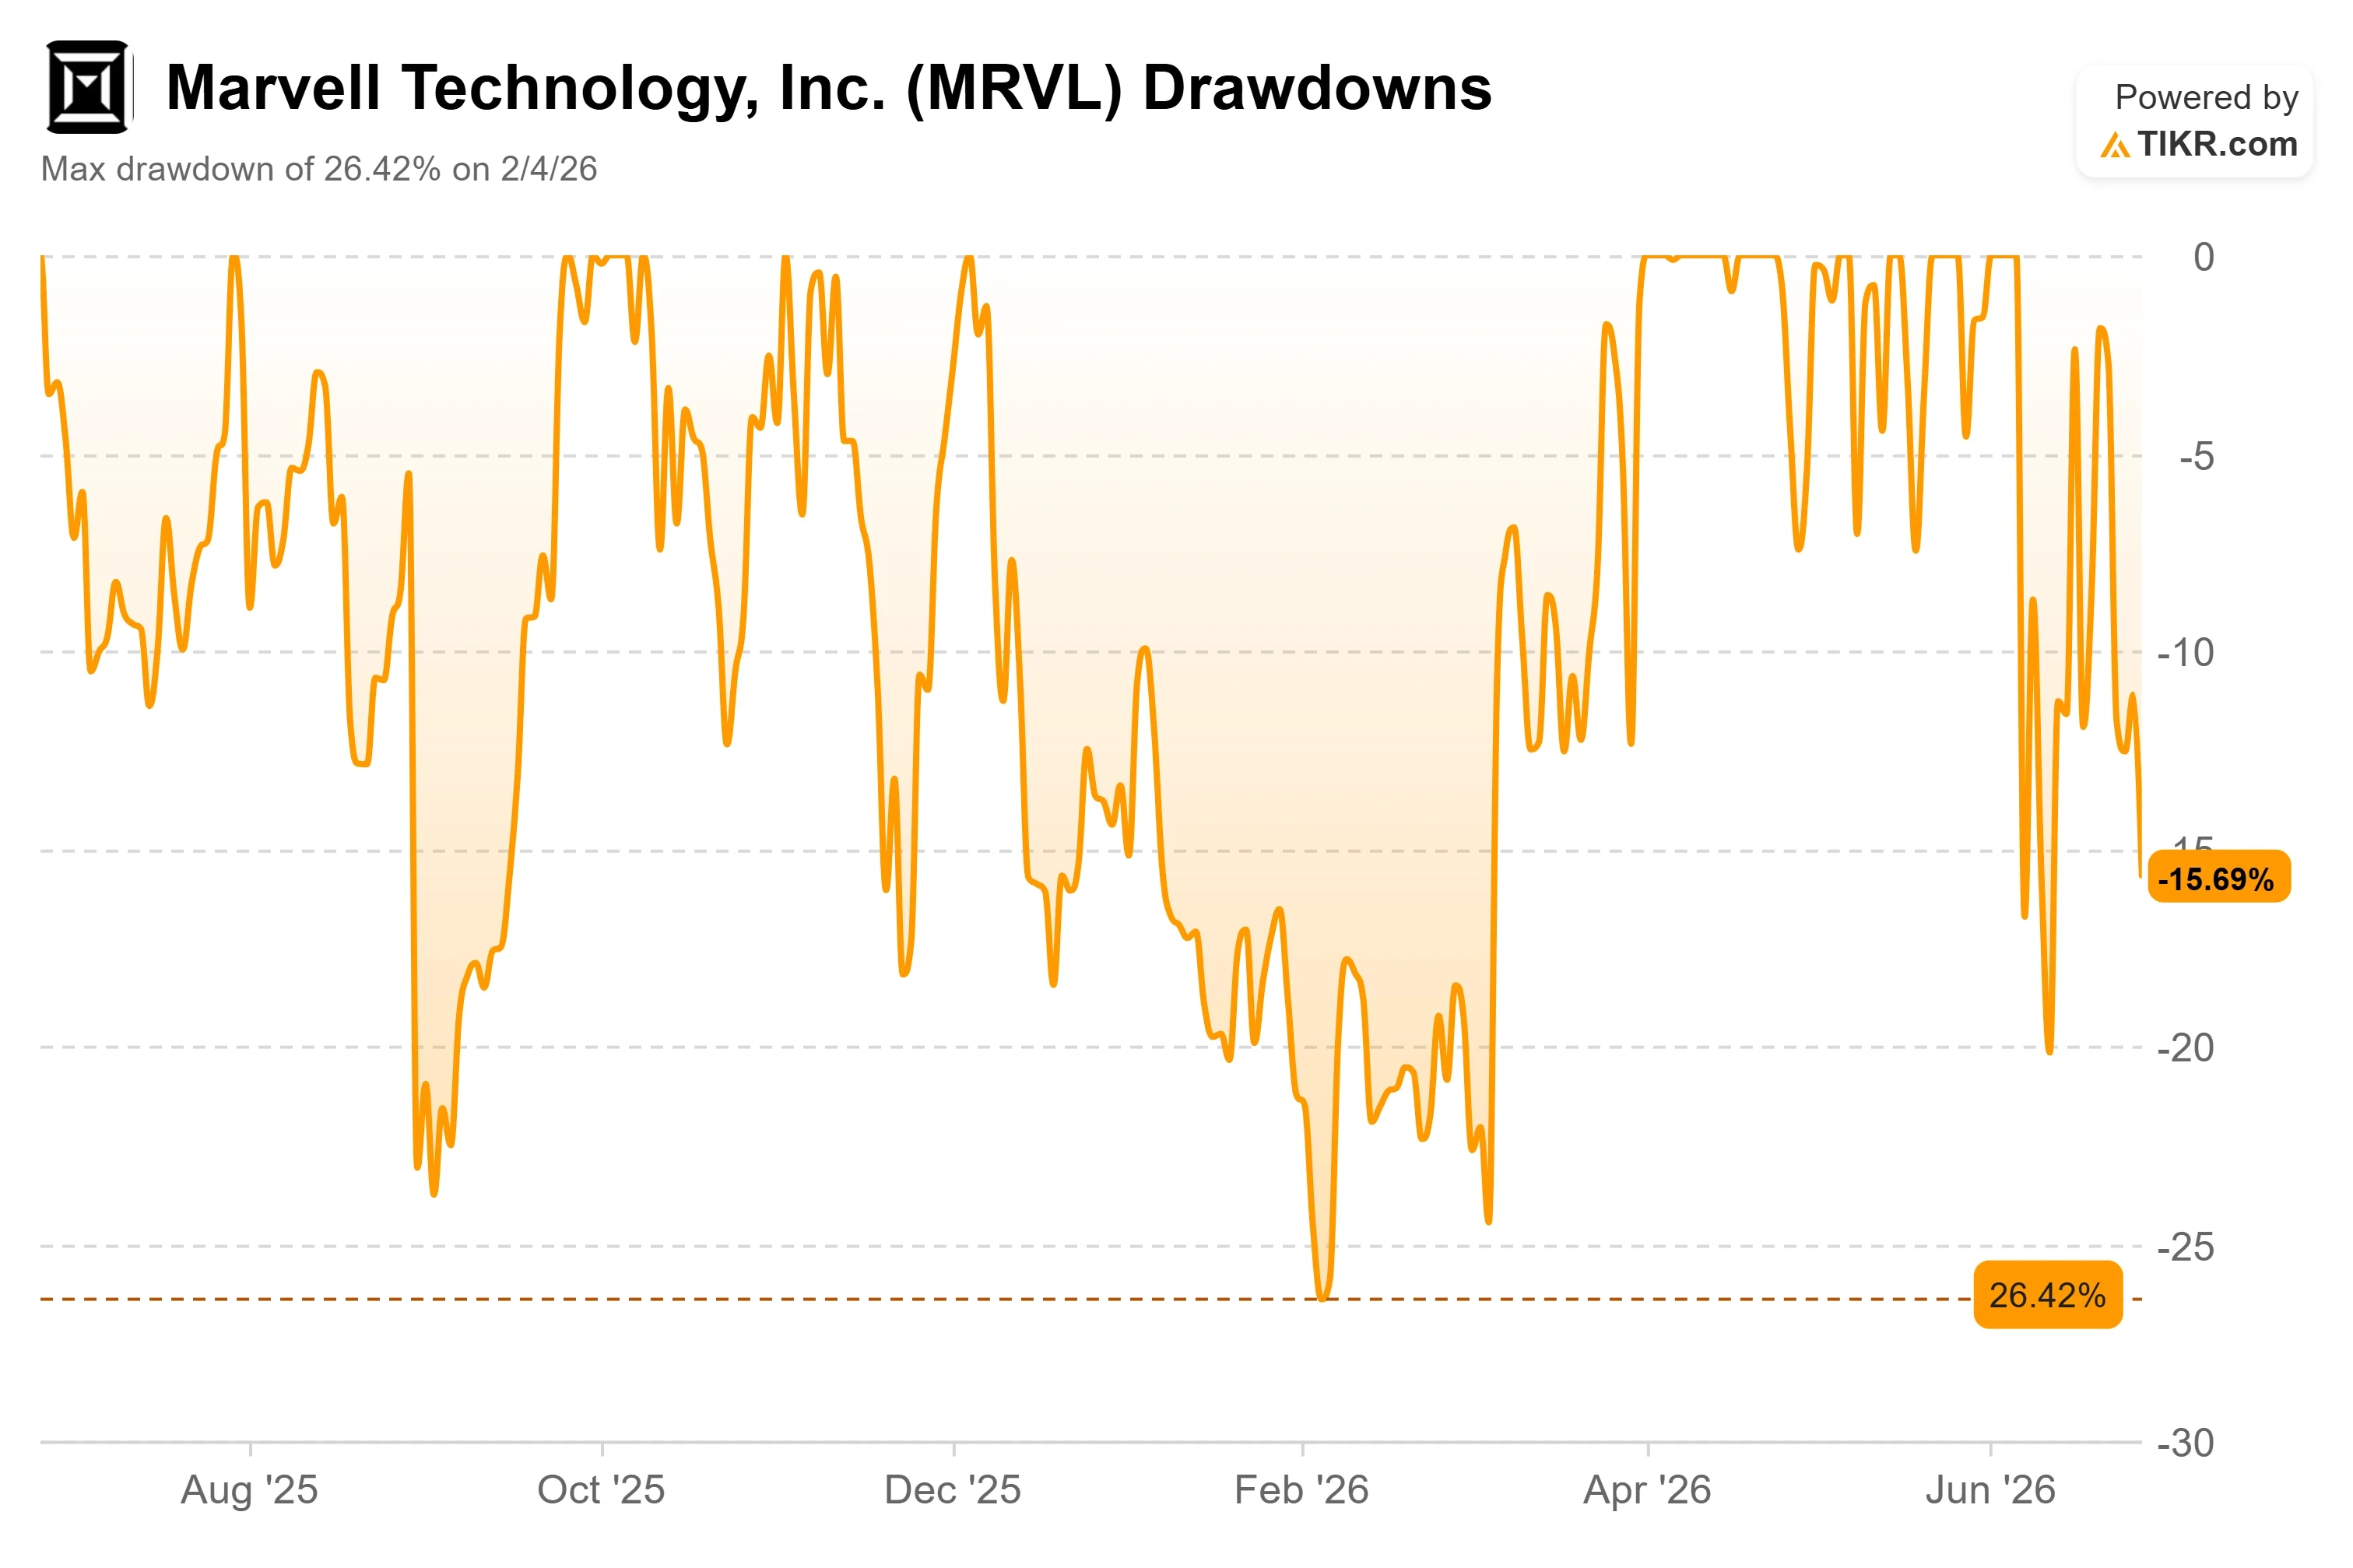 Marvell Drawdowns (TIKR)
See historical and forward estimates for Marvell stock (It’s free!) >>>
The Fundamentals Going the Other Way
Underneath the noise, the business is accelerating, not slowing. Marvell delivered record first-quarter fiscal 2027 revenue of $2.42 billion, up 28% year over year, and guided second-quarter revenue to around $2.7 billion, implying roughly 35% growth. Its fiscal year ends in January, so this is the current year’s pace. Operating cash flow hit a record $638.8 million. The stock reaction to that May 27 print was a modest +3.09%, which tells you how much good news was already in the price.
The strategic case rests on diversification, and management spent its most recent public appearance making exactly that argument. At the Bank of America Global Technology Conference on June 3, CEO Matt Murphy pushed back on the idea that Marvell is a one-product story. “We’re not a one-trick pony,” he said, pointing to three separate billion-dollar businesses, broadband analog, cloud switching, and data center interconnect (DCI, the optical links that carry AI workloads between data centers), each scaling in the next year alone. That breadth is the answer to the concentration fear bears keep circling, since Marvell’s largest customers still account for the bulk of revenue.
Murphy was equally direct about expectations. When Nvidia CEO Jensen Huang called Marvell “the next trillion-dollar company” on stage at COMPUTEX, the comment helped spark a 24% single-day jump. Murphy’s own reaction was more measured: “I think, I said, we have a little work to do still.” For a management team that spent the past two years resetting investor expectations after the custom-silicon business ran ahead of what it had promised, that restraint is the point. The Nvidia partnership itself is real and strategic, built on years of joint work, and according to press reports, includes a $2 billion Nvidia investment alongside collaboration on custom silicon and NVLink adoption.
Where the Valuation Tension Actually Sits
Marvell is not cheap, and the comparison to its own peers makes that plain. The stock trades at around 47x next-twelve-month EV/EBITDA, against a peer-group median near 22x for the semiconductor cohort TIKR tracks. Broadcom, the closest comparable in the custom-AI-silicon trade, sits at roughly 19x on the same measure, and Nvidia at around 15x. On price to forward earnings, Marvell’s roughly 59x towers over Broadcom’s 23x and Nvidia’s 19x. By any peer lens, investors are paying a steep premium for Marvell specifically.
The premium is not indefensible. Marvell’s forward two-year revenue CAGR of around 43% runs well ahead of the larger, more mature names it trades against, and a company growing the top line at that clip with expanding margins can justify a multiple the rest of the group cannot. The catch is that a 47x EV/EBITDA multiple leaves no room for error. Any stumble in the custom ramp, any sign one large cloud customer is pulling orders in-house, and a stock priced this finely reprices fast in the other direction. KeyBanc captured the more durable version of the bull case when it raised its target to a Street-high $385 on June 18, arguing that Marvell’s optical networking, not its headline custom chips, is the steadier growth engine. That distinction matters because connectivity is a market Marvell helps create, while custom silicon depends on a handful of customer programs it cannot fully control.
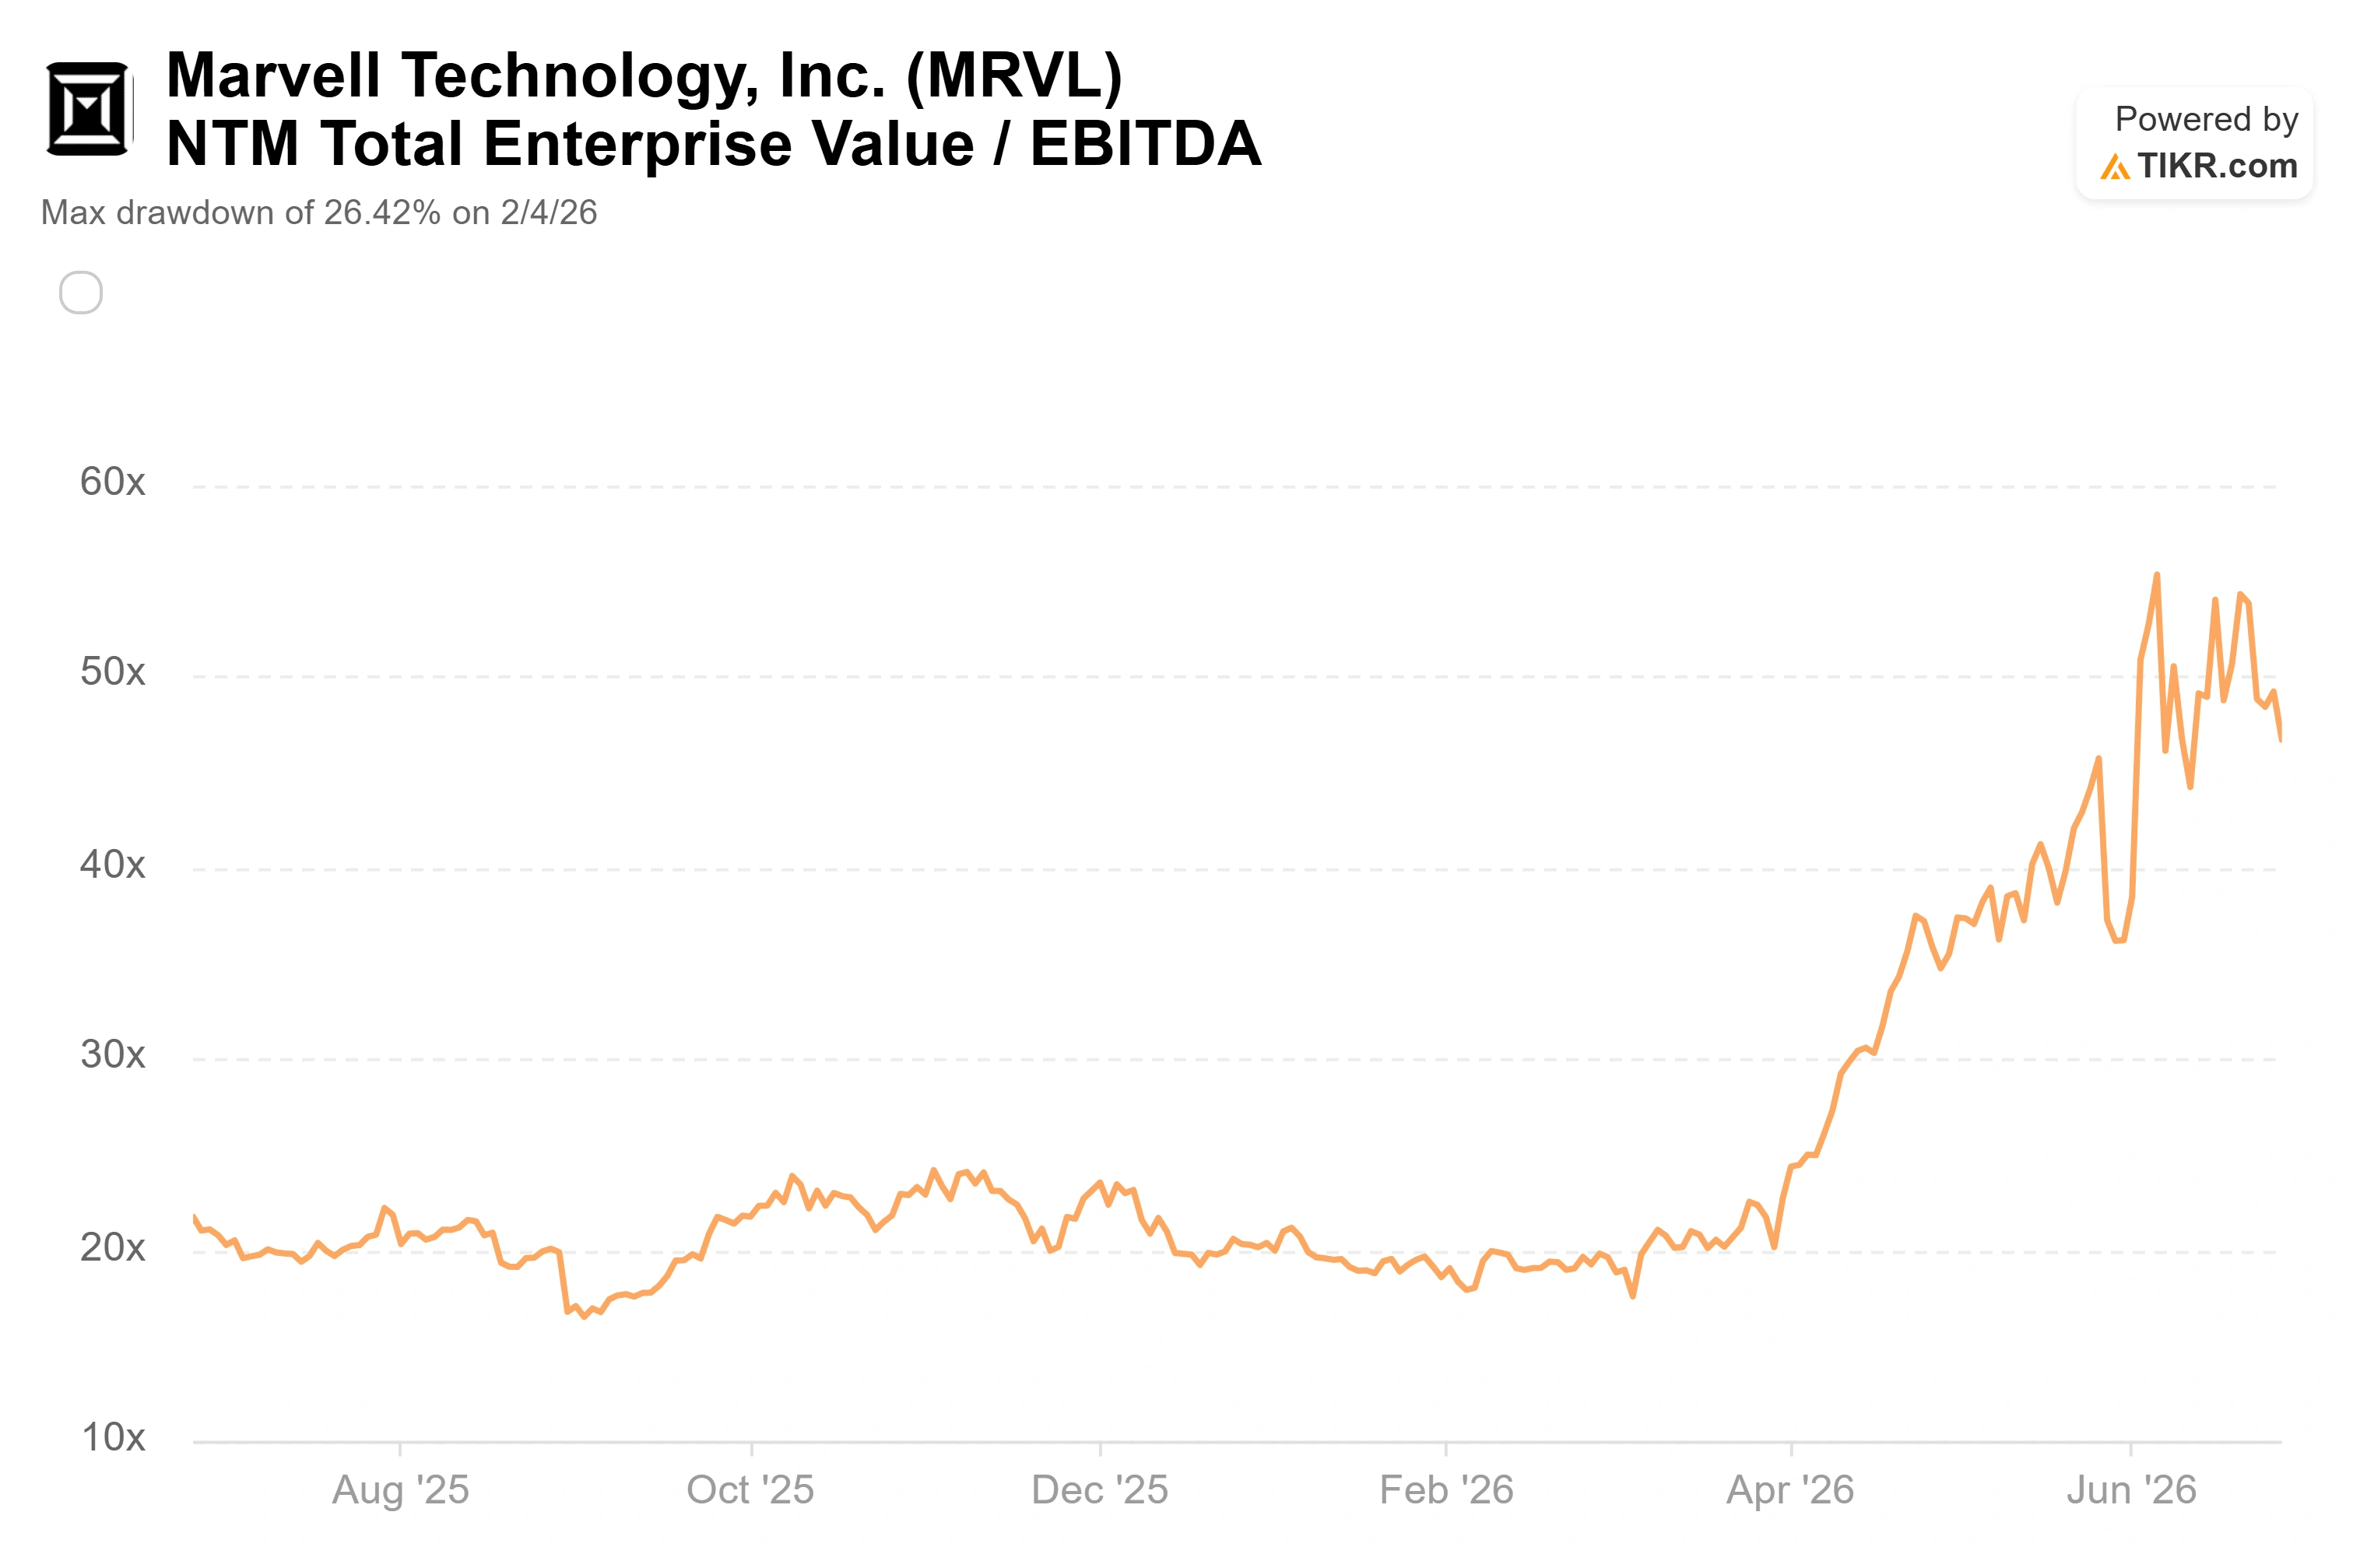 Marvell NTM EV/EBITDA (TIKR)
See how Marvell performs against its peers in TIKR (It’s free!) >>>
TIKR Advanced Model Analysis
- Current Price: $266.77
- Target Price (Mid): ~$820
- Potential Total Return: ~208%
- Annualized IRR: ~28% / year
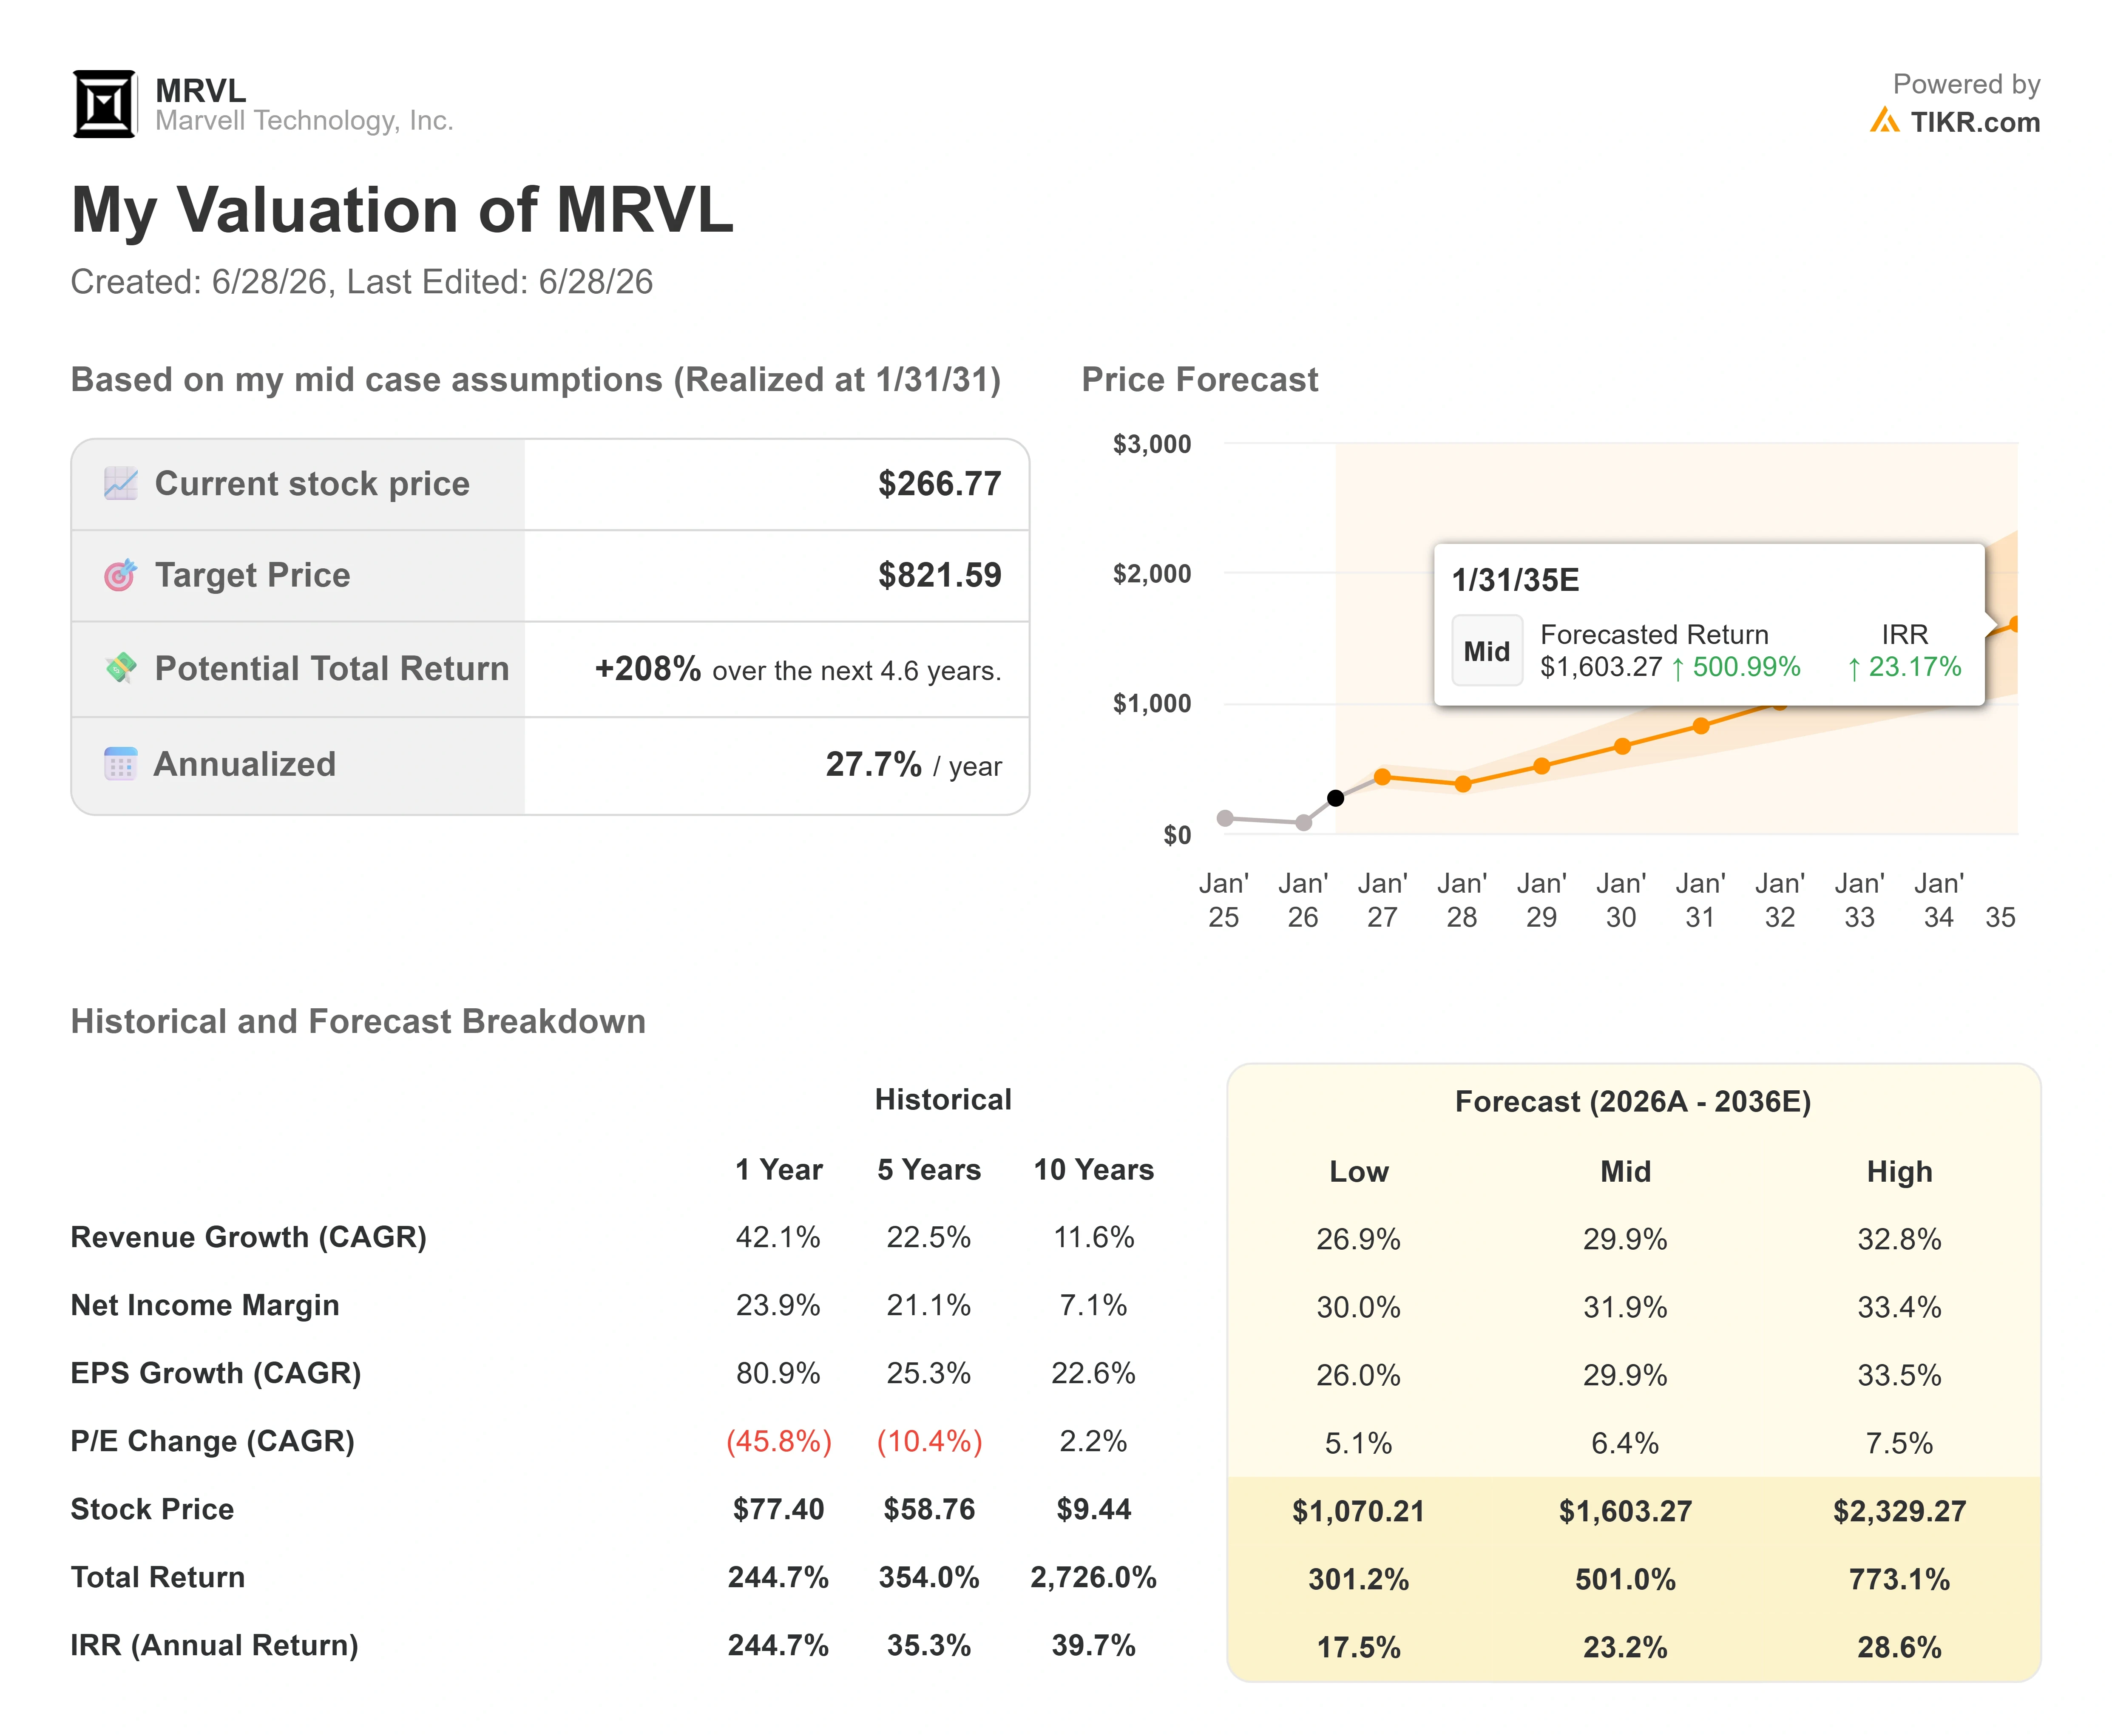 Marvell Advanced Valuation Model (TIKR)
See analysts’ growth forecasts and price targets for Marvell stock (It’s free!) >>>
Using the mid-case scenario, the TIKR Valuation Model points to a target of around $820, realized by fiscal 2031 (January 2031), implying roughly 208% total return and an annualized IRR of about 28% per year. The two revenue CAGR drivers are the custom-silicon ramp toward the company’s multibillion-dollar 2028 target and the optical-interconnect business riding the AI scale-out and scale-up transition. The margin driver is operating leverage as the data center mix climbs toward 75% of revenue and beyond, lifting net income margin to around 32% in the mid case. The primary risk is customer concentration: a pullback or in-sourcing by one large hyperscaler would hit revenue and the multiple at once.
The upside case is straightforward: if data center growth holds near the 55% pace management signals for next year and the custom business more than doubles as guided, the model’s around 30% forward revenue CAGR is achievable, and the premium is earned.
The downside is just as clear: a custom-ramp stumble at 47x EV/EBITDA exposes the stock to a sharp repricing, the same fragility the CFO filing revealed in a single session.
Conclusion
The June index pop and the late-week selloff are both noise. The number that matters is the data center growth rate in second-quarter fiscal 2027 earnings, due around August 27, 2026. Management has guided the rate toward 55% and reaffirmed the roughly $16.5 billion fiscal 2028 revenue target. A print that confirms that pace, with the target intact, validates the premium and likely pulls the lagging Street average up toward where the stock already trades. Anything that hints the custom ramp is slipping hands bears their case and leaves a 47x EBITDA stock badly exposed. Watch the August data center number, not the rear-view CFO headline.
See what stocks billionaire investors are buying so you can follow the smart money with TIKR.
Should You Invest in Marvell?
The only way to really know is to look at the numbers yourself. TIKR gives you free access to the same institutional-quality financial data that professional analysts use to answer exactly that question.
Pull up Marvell, and you’ll see years of historical financials, what Wall Street analysts expect for revenue and earnings in the quarters ahead, how valuation multiples have moved over time, and whether price targets are trending up or down.
You can build a free watchlist to track Marvell alongside every other stock on your radar. No credit card required. Just the data you need to decide for yourself.
Analyze Marvell on TIKR Free →
Looking for New Opportunities?
- See what stocks billionaire investors are buying so you can follow the smart money.
- Analyze stocks in as little as 5 minutes with TIKR’s all-in-one, easy-to-use platform.
- The more rocks you overturn… the more opportunities you’ll uncover. Search 100K+ global stocks, global top investor holdings, and more with TIKR.
Disclaimer:
Please note that the articles on TIKR are not intended to serve as investment or financial advice from TIKR or our content team, nor are they recommendations to buy or sell any stocks. We create our content based on TIKR Terminal’s investment data and analysts’ estimates. Our analysis might not include recent company news or important updates. TIKR has no position in any stocks mentioned. Thank you for reading, and happy investing!
You May Also Like

Ethereum koers toont zeldzaam dubbel koopsignaal en richt zich op $4.550

Fed Day Dry Powder: Cryptoquant Analyst Tracks $7.6B Stablecoin Pile on Exchanges
Michael Saylor’s Bitcoin Treasury Strategy Has Finally Hit Its Breaking Point

