

Salesforce and The Trade Desk Are Both Down More Than 30%: Is Either a Buy Yet?
Key Takeaways
- TIKR’s model targets around $307 for Salesforce stock at roughly 15% per year versus around $25 for The Trade Desk stock at 7%.
- Salesforce consensus revenue growth of 11% is backed by $33.6 billion in remaining performance obligations growing 13% in constant currency.
- The Trade Desk stock trades at 9x forward earnings, down from 40x fifteen months ago, the deepest compression in its public history.
- Salesforce stock now trades at 11x forward earnings, the lowest multiple in its entire public history despite generating $14.5 billion in estimated annual free cash flow.
- The key risk in Salesforce stock is Agentforce monetization timing; in The Trade Desk stock, it is continued ad spending weakness in CPG and auto.
Salesforce stock and The Trade Desk stock are both trading at the cheapest forward earnings multiples in years. TIKR lets you pull up CRM and TTD side by side with the same institutional-grade data professional analysts use, for free →
Salesforce Stock Is a Subscription Fortress, The Trade Desk Stock Rides the Ad Cycle
Salesforce stock (CRM) and The Trade Desk stock (TTD) have both fallen more than 30% from their recent highs, but the businesses behind those drops could hardly be more different.
One sells subscription software that companies use to manage customer relationships, run sales teams, and now deploy AI agents.
The other runs the largest independent platform for buying digital advertising programmatically, with its fortunes tied directly to how much brands are spending on ads. The shared selloff creates a natural comparison, but picking between them requires understanding why the market punished each and whether that punishment was proportional to the actual risk.
Salesforce is a $46 billion annual revenue business (based on its fiscal 2027 guide) built almost entirely on recurring subscriptions.
 CRM Stock Q1 2027 Earnings in USD (TIKR)
In Q1, the company delivered $11.13 billion in revenue, up 13% year over year, with current remaining performance obligations of $33.6 billion growing 13% in constant currency. Management raised full-year revenue guidance and reiterated a 34% non-GAAP operating margin framework.
The AI story is accelerating: Agentforce annual recurring revenue crossed $1 billion, with 28.6 trillion tokens processed in the quarter, up 152% quarter over quarter.
Salesforce also commenced a $25 billion accelerated share repurchase, reducing its diluted share count by 10% year over year.
The business is steady, the margin trajectory is expanding, and the capital return program is aggressive.
Meanwhile, The Trade Desk operates in a structurally different world.
 TTD Stock Q1 2026 Earnings in USD (TIKR)
The company earned $689 million in Q1 revenue, up 12% year over year, with connected TV representing roughly half of its business and audio growing faster than any other channel. Management guided Q2 revenue of at least $750 million, implying growth of roughly 9%, a deceleration from 12% in Q1 and 18% a year earlier.
CEO Jeff Green framed the slowdown as cyclical, not structural, pointing to macro pressures on CPG and automotive advertisers navigating tariffs and consumer softness. The company’s JBP signings grew 55% year over year, with March as the biggest signing month on record, suggesting the platform is gaining strategic commitments even as near-term spending slows.
The Trade Desk also committed to at least 40% adjusted EBITDA margins for the full year, approximately in line with the prior year.
The tension between these two businesses is the core of this comparison.
Salesforce compounds through subscription renewals and expanding platform adoption, insulating it from any single quarter’s macro conditions. The Trade Desk earns its revenue from discretionary advertising budgets that rise and fall with the economic cycle.
Both are down 30% or more, but the nature of the risk embedded in each drop is fundamentally different.
Salesforce’s Agentforce just crossed $1 billion in ARR while The Trade Desk signed a record number of JBPs in March. Want to track how analyst sentiment on CRM and TTD is shifting? See rating changes and price target revisions for both with TIKR for free →
Salesforce Stock Estimates Hold Steady While The Trade Desk Stock Growth Decelerates
Salesforce’s subscription model creates a floor under its growth rate that advertising-dependent businesses simply do not have.
 CRM Stock Revenue and FCF Actuals & Estimates (TIKR)
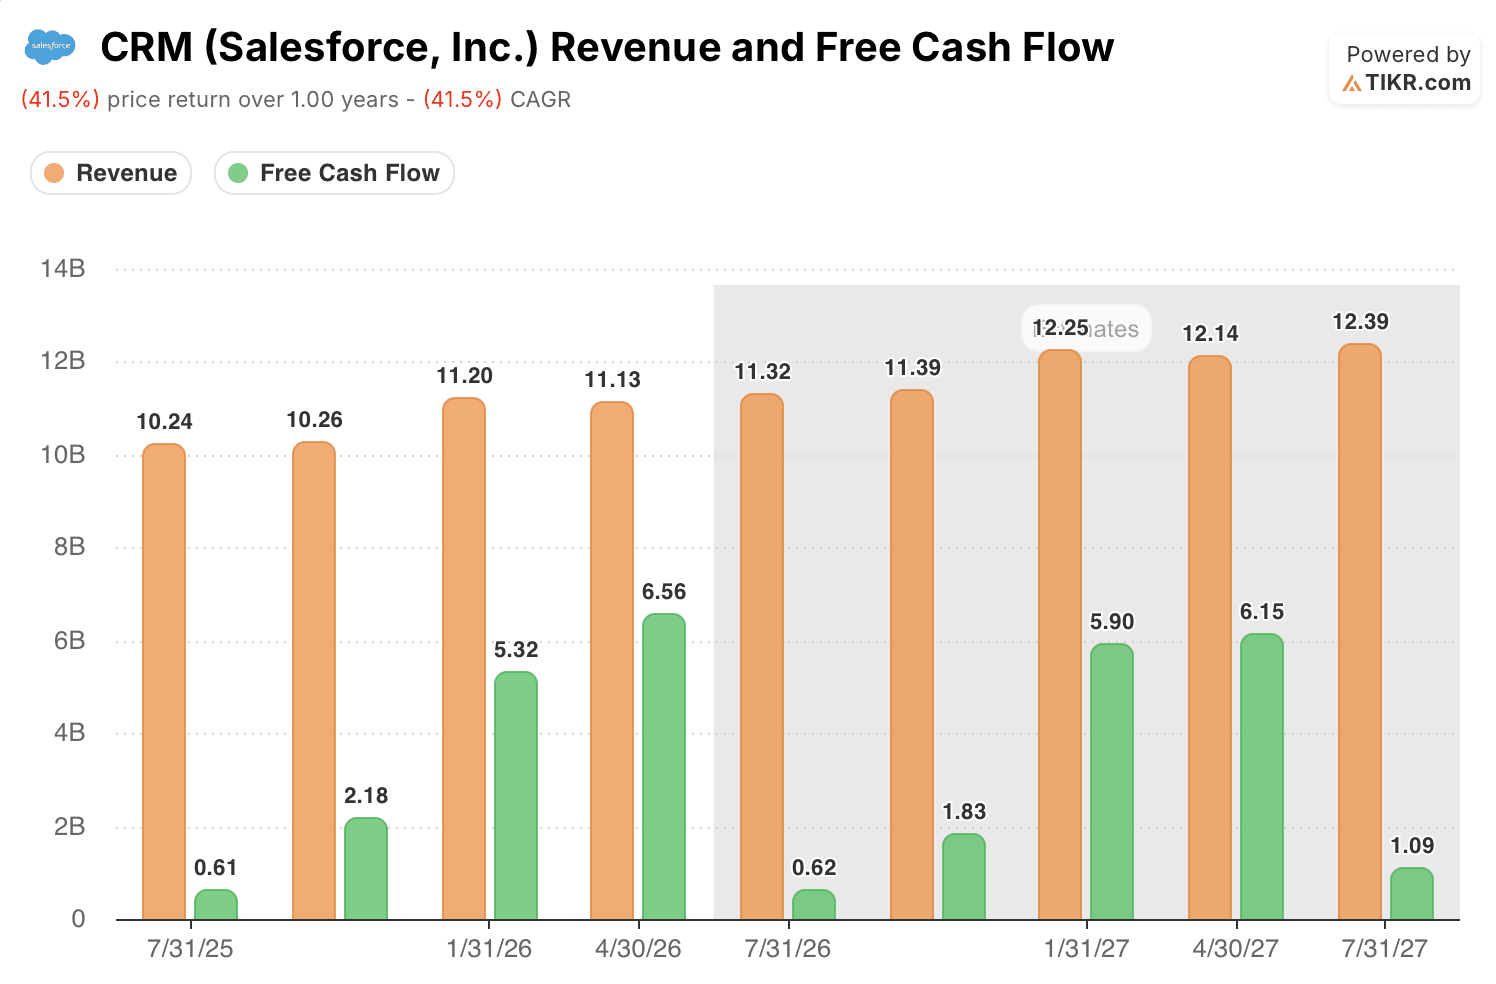
Salesforce consensus revenue for fiscal 2027 sits at approximately $46 billion, with analysts expecting quarterly revenue to climb steadily from $11.32 billion in Q2 to $12.25 billion by Q1 of fiscal 2028, reflecting consistent 9% to 11% growth each quarter.
Free cash flow tells the same steady story, with analysts estimating full-year FCF of approximately $14.5 billion across fiscal 2027, swinging from $0.62 billion in the seasonally weak Q2 all the way to $5.90 billion in Q4 as enterprise renewals concentrate in the back half.
The Trade Desk is growing faster, but the trajectory is bumpier.
 TTD Stock Revenue and Revenue Growth Actuals & Estimates (TIKR)
Consensus revenue for fiscal 2026 totals roughly $3.2 billion, representing approximately 10% growth, but analysts expect that to slow to 8% in Q2 before recovering to 11% by Q1 of the following year as ad budgets stabilize.
The selloff has reset both valuations to levels that are historically cheap, but the story is different for each stock.
 CRM Stock Normalized Earnings (TIKR)
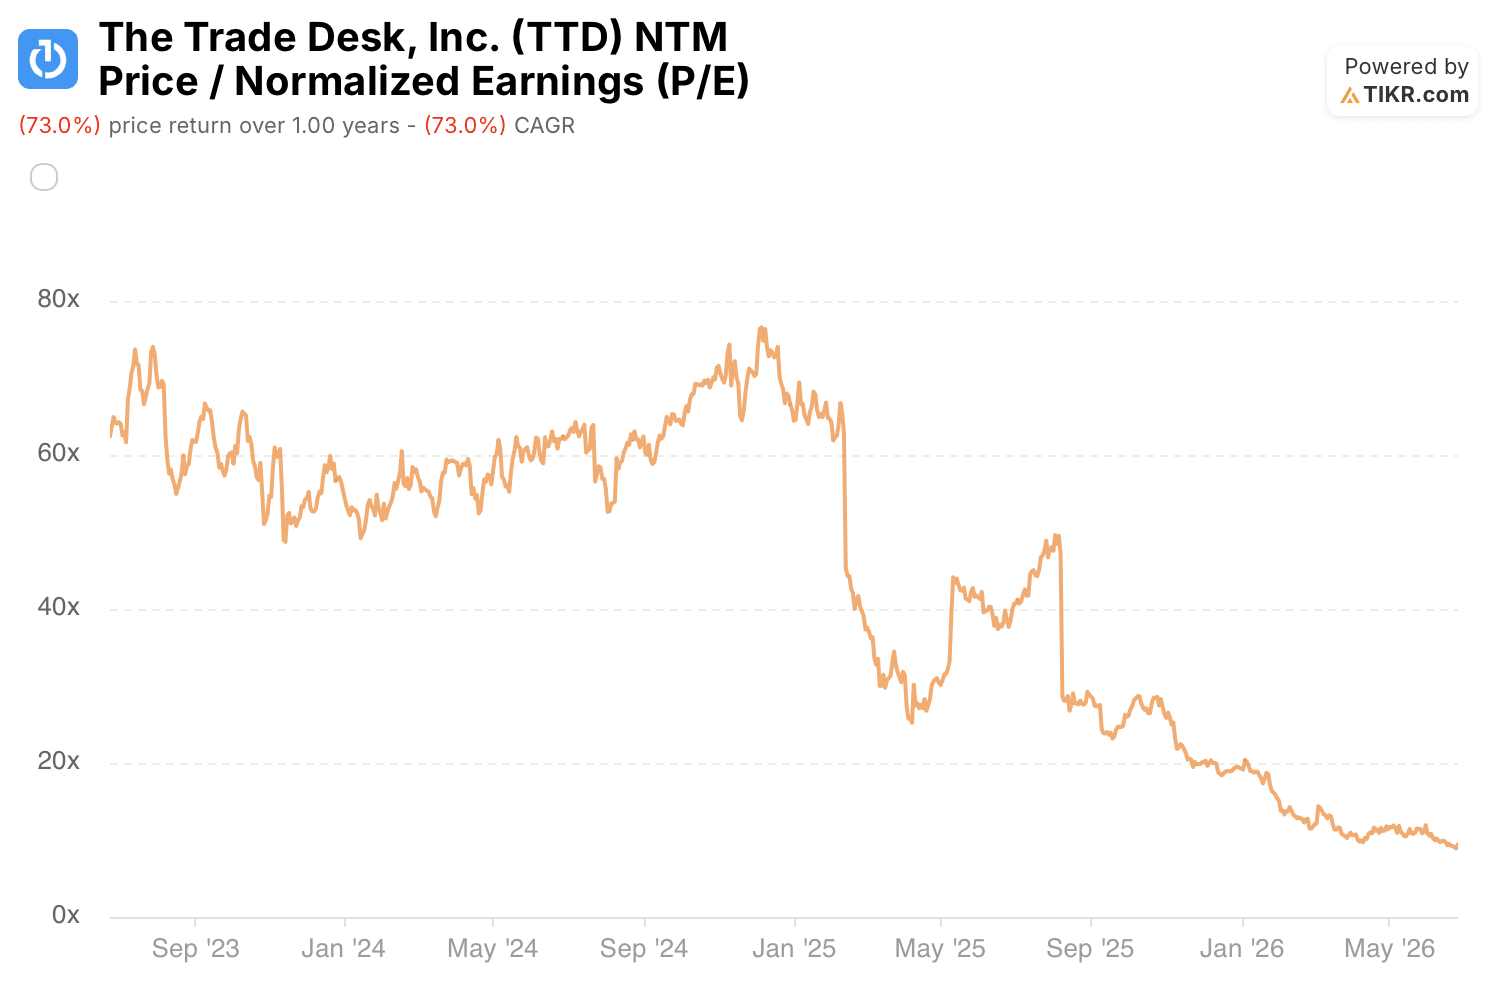
Salesforce stock now trades at 11x forward earnings, the lowest multiple in its entire public history for a business that spent most of the last decade trading between 50x and 150x.
 TTD Stock Normalized Earnings (TIKR)
Meanwhile, The Trade Desk stock has compressed even more dramatically, falling from nearly 40x forward earnings fifteen months ago to just 9x today — below Salesforce’s multiple for the first time, despite The Trade Desk historically trading at a significant premium to reflect its faster growth.
The risk in Salesforce stock is whether Agentforce’s $1 billion in ARR translates into a sustained revenue growth driver or plateaus as an incremental feature within existing seat licenses.
The risk in The Trade Desk stock is an extended advertising spending pullback in CPG and automotive that pushes growth below consensus for multiple quarters.
The catalyst for Salesforce stock is the second-half subscription revenue reacceleration management has committed to. The catalyst for The Trade Desk stock is the Q3 and Q4 earnings cycle, where easier comparisons could confirm whether the deceleration was cyclical or structural.
Salesforce Stock Grows Steadily, The Trade Desk Stock Keeps More of Every Ad Dollar
 CRM Stock and TTD Stock Gross Margins (TIKR)
Salesforce and The Trade Desk both have gross margins of roughly 77% to 78% on a trailing basis, but that surface-level similarity obscures very different profitability stories underneath.
Salesforce’s gross margins have been virtually unchanged for two years, holding between 77% and 78% every single quarter regardless of macro conditions.
That consistency is the point: a subscription business with locked-in enterprise contracts does not lose margin when the economy slows, because its revenue does not slow with it.
 CRM Stock and TTD Stock Operating Margins (TIKR)
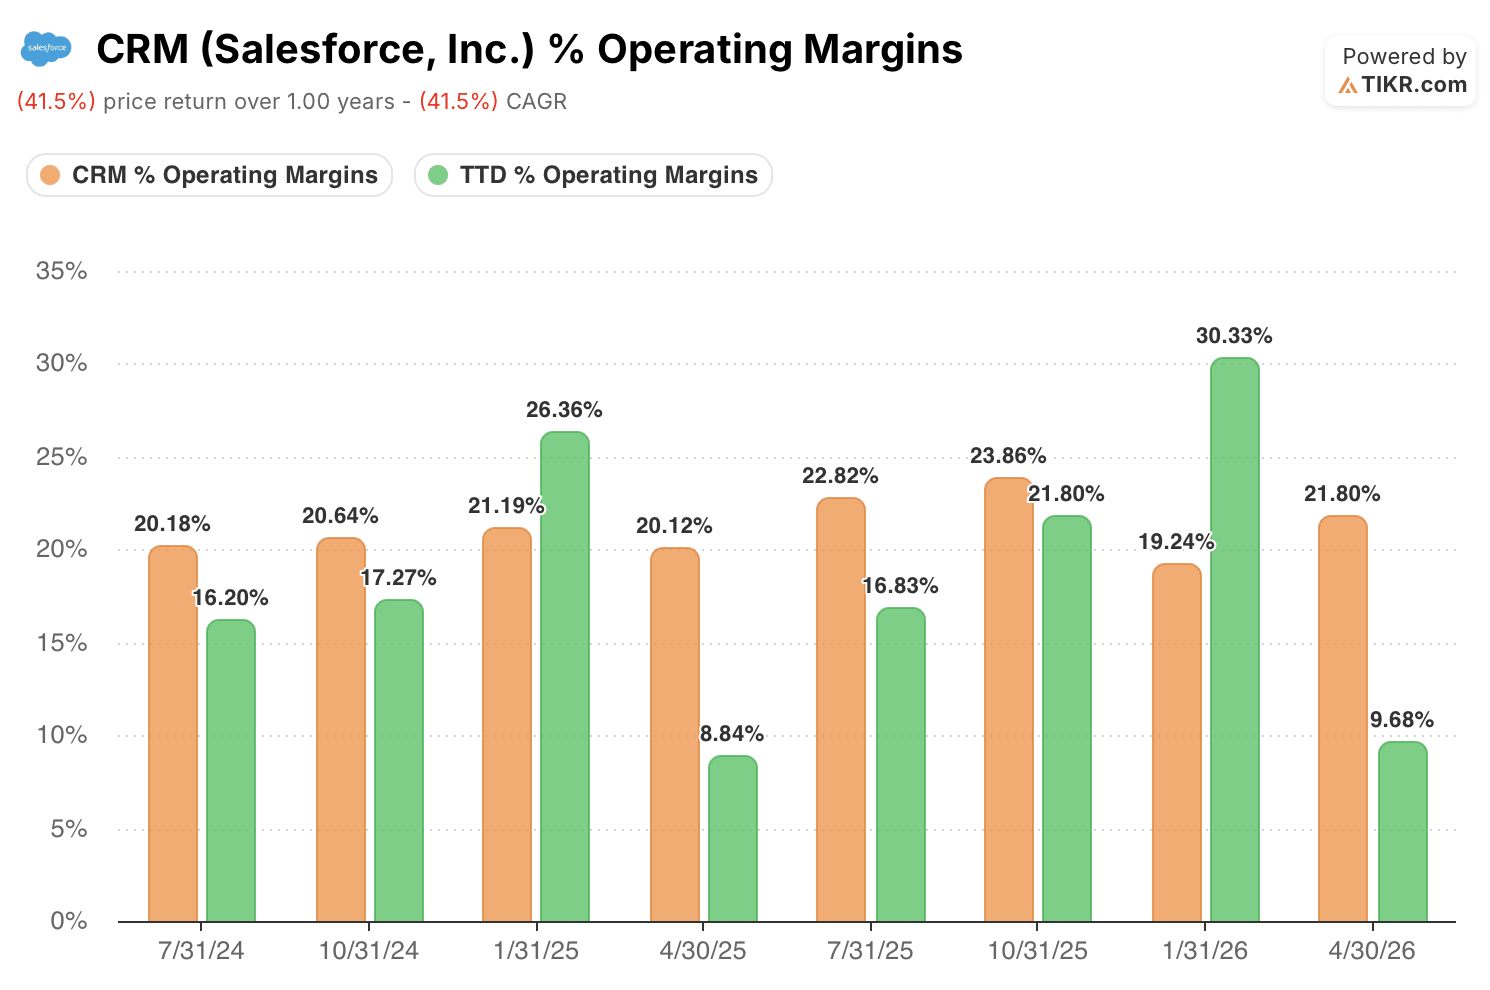
Salesforce’s operating margin has generally expanded from 20% two years ago, reaching as high as 24% before pulling back to 22% in the most recent quarter, while The Trade Desk posted 22% in Q3 and 30% in Q4 of last year, numbers that look comparable on the surface but mask the fact that Q1 snapped back to just 10% as holiday ad spending dried up.
The Trade Desk’s profitability profile is faster and swingier, which is exactly what you would expect from a business tied to the advertising cycle.
TTD’s gross margins swing from 74% in Q1, the seasonally weakest quarter, to 81% in Q4 when holiday ad spending floods the platform, and operating margins follow the same pattern, ranging from 10% in Q1 to 30% in Q4.
TIKR’s Model Sees 15% Per Year for Salesforce Stock vs 7% for The Trade Desk Stock
TIKR’s valuation model values Salesforce stock at approximately $307 by January 2031, implying around 94% total return from the current price of approximately $158, or roughly 15% per year.
 CRM Stock Valuation Model Results (TIKR)
The 15% annualized return rests on subscription renewal dynamics that have already demonstrated 9% to 13% quarterly growth over the past two years, making the mid-case revenue assumption the most conservative reading of what this business has already proven it can do.
The target is credible as long as Agentforce adoption expands the platform rather than simply replacing existing seat-based revenue, and the headcount discipline that produced margin expansion in Q1 continues through fiscal 2030.
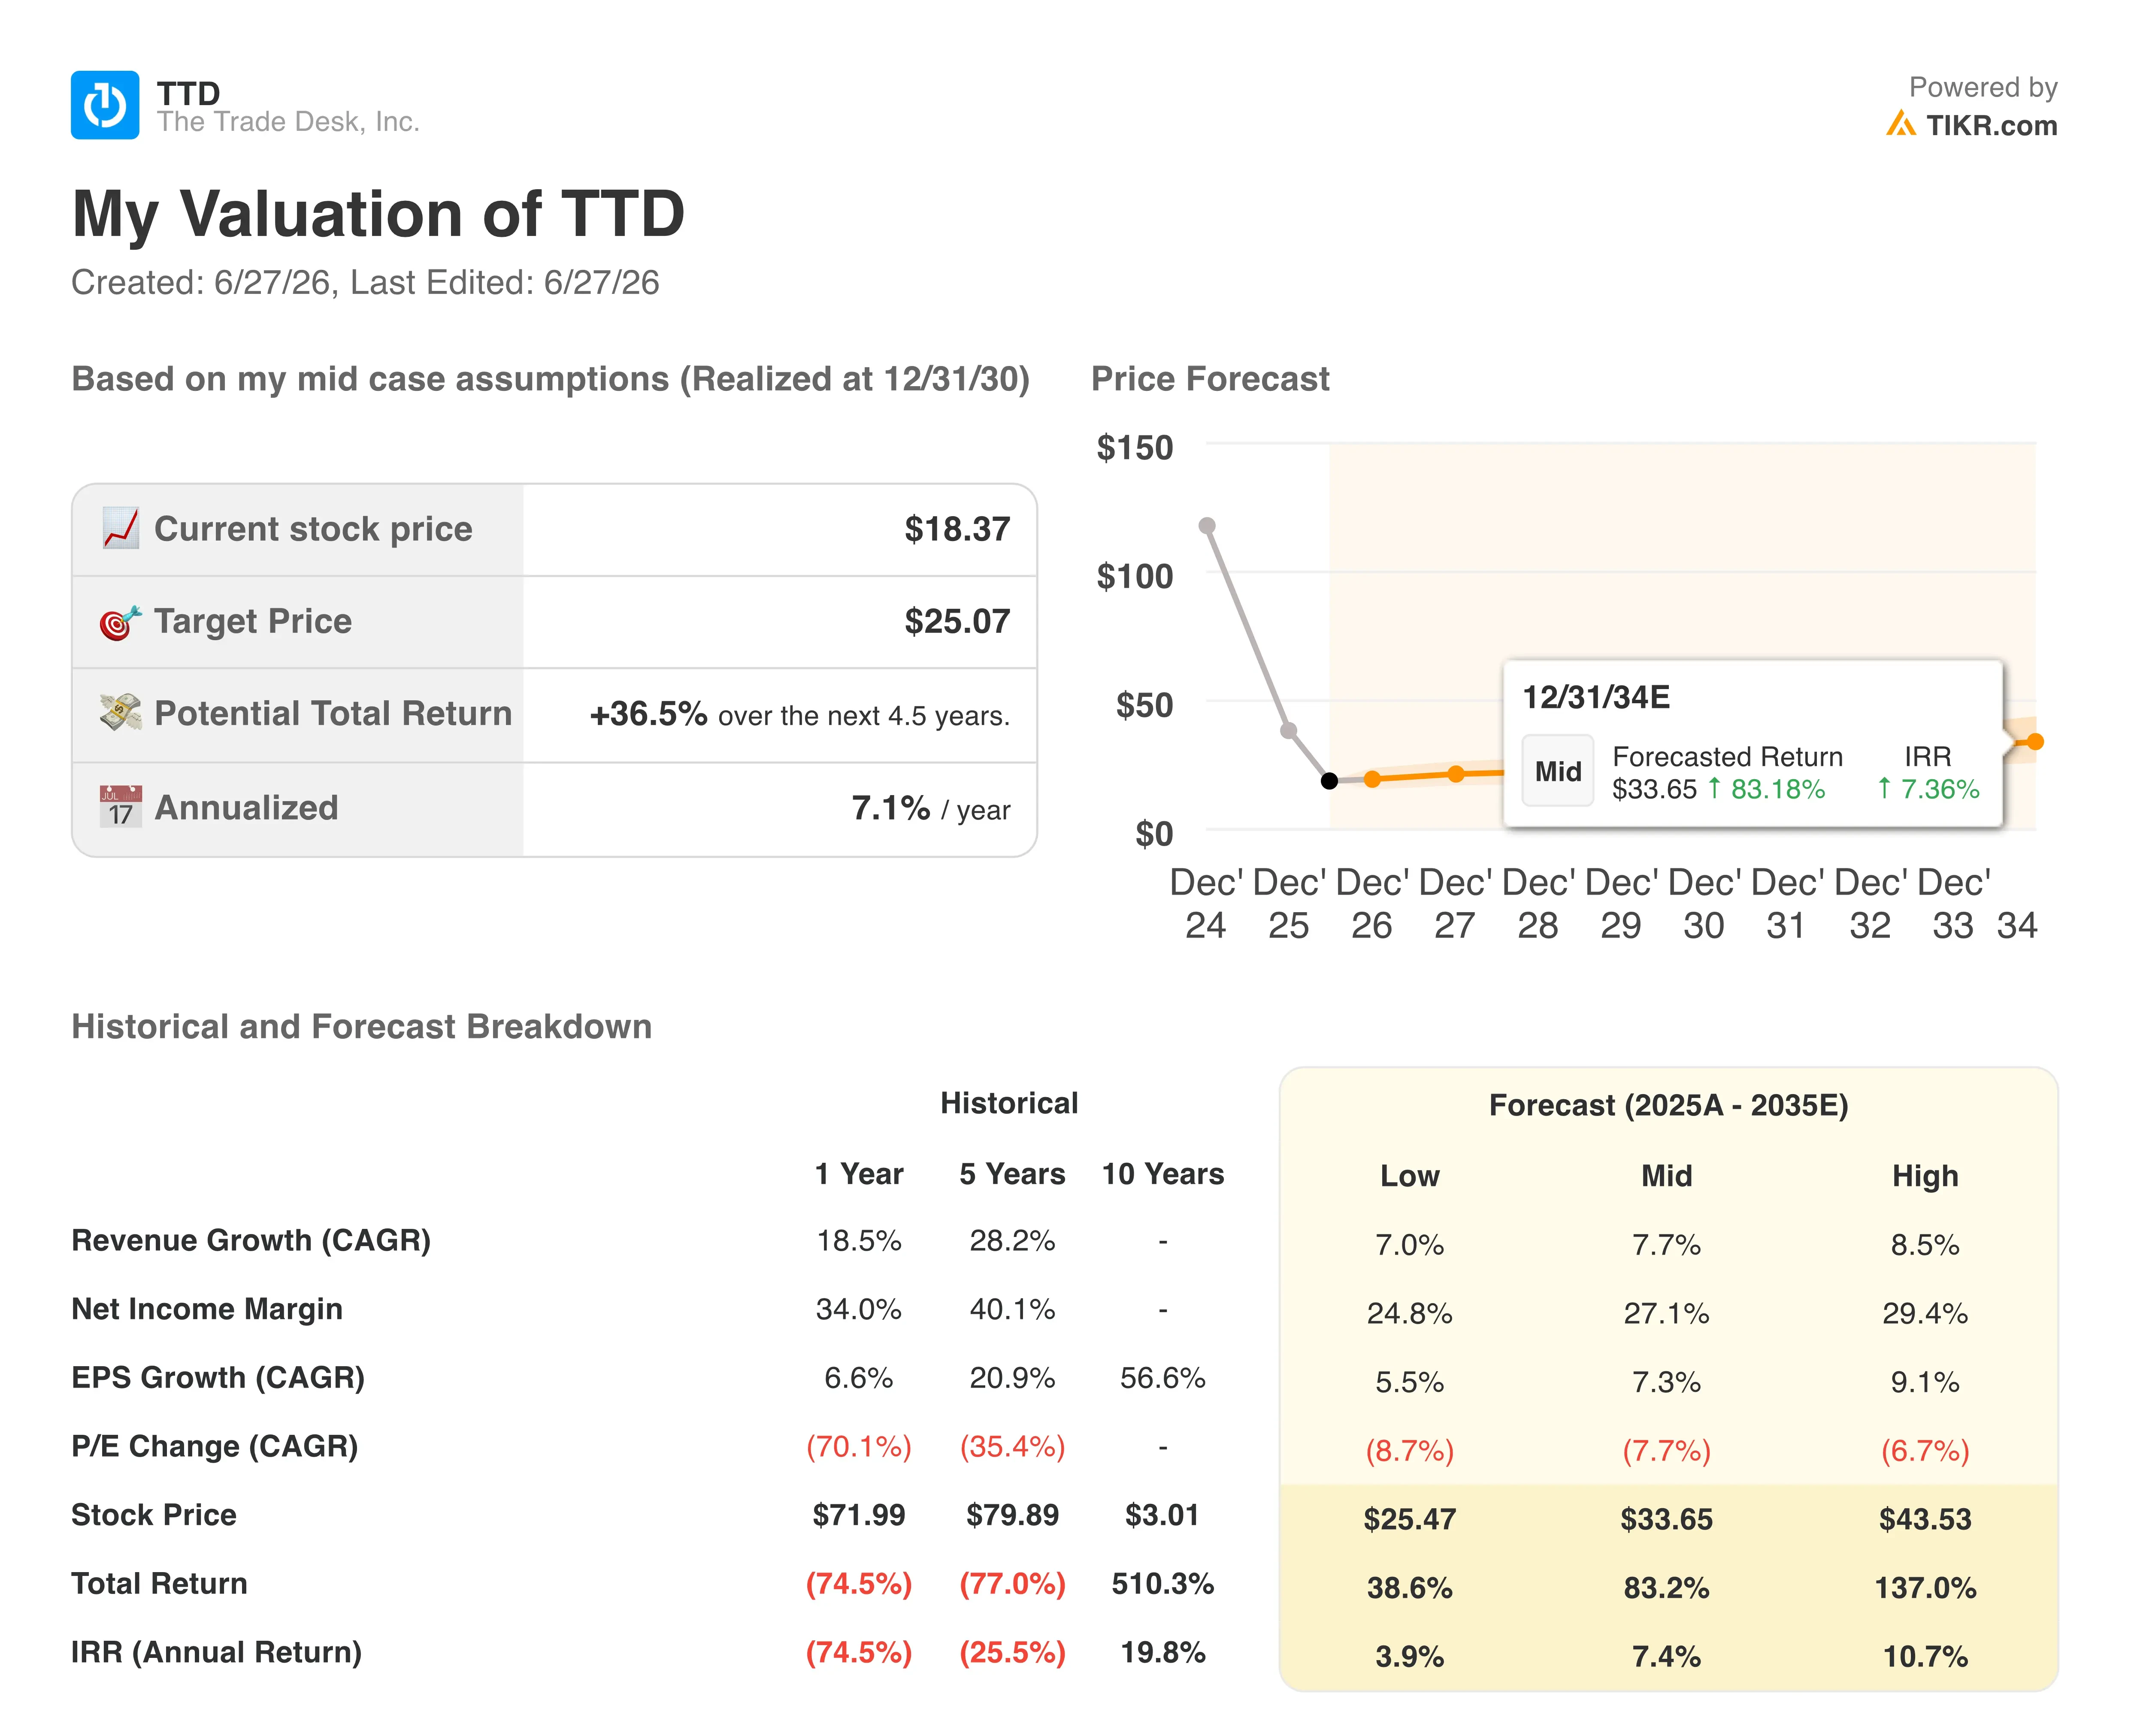
TIKR’s valuation model values The Trade Desk stock at approximately $25 by December 2030, implying around 37% total return from the current price of approximately $18, or roughly 7% per year.
 TTD Stock Valuation Model Results (TIKR)
The 7% annualized return is notably modest for a company that grew revenue 18% last year and at a 28% CAGR over the past five years, and it reflects the model pricing in the current deceleration rather than a recovery scenario.
The target depends on CTV adoption continuing to shift linear television budgets into programmatic channels and advertiser spending in CPG and automotive stabilizing from current levels.
Salesforce stock appears undervalued at current levels, with a 15% annualized return backed by $33.6 billion in contracted remaining obligations and a subscription base that has never posted negative organic growth.
The Trade Desk stock appears more modestly positioned, with a 7% annualized return that reflects real execution risk around growth re-acceleration in a business model that rises and falls with advertiser confidence.
TIKR’s model implies roughly double the annualized return for Salesforce stock relative to The Trade Desk stock, a gap that closes only if The Trade Desk’s growth re-accelerates meaningfully from where consensus sits today.
Wall Street’s best ideas don’t stay hidden for long. Catch analyst upgrades, earnings beats, and revenue surprises on thousands of stocks the moment they happen with TIKR for free →
Should You Invest in Salesforce or The Trade Desk?
The only way to really know is to look at the numbers yourself. TIKR gives you free access to the same institutional-quality financial data that professional analysts use to answer exactly that question.
Pull up Salesforce stock and The Trade Desk stock and you’ll see years of historical financials, what Wall Street analysts expect for revenue and earnings in the quarters ahead, how valuation multiples have moved over time, and whether price targets are trending up or down for both companies.
You can build a free watchlist to track Salesforce and The Trade Desk alongside every other stock on your radar. No credit card required. Just the data you need to decide for yourself.
Access Professional Tools to Analyze CRM and TTD stock on TIKR for Free →


You May Also Like

Martin Armstrong Says Gold's 30% Correction May Be Nearly Complete—Here's Why

Vitalik Buterin Proposes Self-Sovereign AI Stack To Protect Users From Risks Of AI Agents


