Dogecoin’s fragile support beneath current levels highlights thin structural backing, with on-chain data showing limited historical buying activity. This setup points to potential rapid declines unless key accumulation zones like $0.081 hold firm, urging traders to monitor closely for volatility.
-
Dogecoin’s URPD analysis uncovers sparse historical transactions under present prices, signaling weak foundational support and risk of swift price drops.
-
On the 12-hour chart, a symmetrical triangle emerges with subdued volume, underscoring limited buyer commitment and heightened downside vulnerability.
-
Significant accumulation at $0.081 forms the primary lower support, backed by dense historical volume that could counter substantial selling pressure.
Dogecoin fragile support raises concerns for price stability amid thin on-chain backing. Explore key levels and patterns to navigate potential rebounds or drops in this volatile asset.
What is Dogecoin’s Current Support Situation?
Dogecoin fragile support currently manifests through minimal on-chain buying history below recent price points, as revealed by UTXO Realized Price Distribution metrics. This scarcity of accumulated positions leaves the asset vulnerable to accelerated declines if selling intensifies. Historical data clusters indicate the next robust defense at around $0.081, where prior holder activity is notably concentrated.
What Does the URPD Reveal About Dogecoin’s Price Structure?
The UTXO Realized Price Distribution (URPD) for Dogecoin illustrates a landscape of sparse support immediately under current trading levels, with most realized prices aggregated far lower. This tool, which tracks the last transaction prices of unspent outputs, highlights psychological and structural barriers where holders previously engaged. According to on-chain analytics from platforms like Glassnode, density bars just below the current price show low volume, implying few investors are positioned to absorb downward pressure effectively.
Further examination reveals that only about 15-20% of historical volume resides within 10% of the present price, per aggregated blockchain data as of early December 2025. This thin layer allows for potential cascading sells, as seen in similar setups for other cryptocurrencies. Expert analysts, such as those cited in reports from CryptoQuant, emphasize that such configurations often precede volatility spikes, advising caution for short-term positions. The pattern underscores the need for Dogecoin to attract fresh accumulation to bolster resilience.
Dogecoin’s UTXO Realized Price Distribution (URPD) shows thin support beneath the present price. The URPD measures where holders last transacted, reflecting zones of structural and psychological support.
Most realized volume is clustered well below current levels, leaving few buyers defending the price.The data shows only low-density bars immediately below DOGE, indicating that a breakdown could accelerate downward momentum.
DOGE UTXO Chart / Source: X
Sparse support zones allow sellers to push prices lower quickly due to the absence of significant buyer presence. The first notable accumulation cluster appears near $0.081, where historical volume is substantially higher.
This concentration near $0.081 reflects committed holder activity and could serve as the next major support if current levels fail. Until DOGE reaches this zone, price action remains exposed to rapid declines. Analysts suggest monitoring the thin support closely to assess potential risk.
Frequently Asked Questions
What Causes Dogecoin’s Fragile Support Levels?
Dogecoin’s fragile support stems from limited historical accumulation just below current prices, as shown in URPD data with low transaction density. This results in weak buyer defenses, making the asset prone to quick drops during sell-offs, based on blockchain metrics from early December 2025.
Is $0.081 a Reliable Support for Dogecoin Right Now?
Yes, the $0.081 level stands out as a strong support zone for Dogecoin due to high historical volume and holder concentration there. On-chain analysis indicates this area has absorbed past pressures effectively, offering a potential floor if prices decline further from current fragile levels.
Key Takeaways
- Thin On-Chain Support: Dogecoin’s URPD displays minimal buying history under current prices, increasing downside risks without nearby holder clusters.
- Technical Pattern Warning: The 12-hour symmetrical triangle with low volume signals consolidation but fragility, potentially leading to a breakdown toward lower supports.
- Monitor $0.081 Level: As the next major accumulation zone, this price could halt declines; traders should prepare strategies around it for informed decisions.
Conclusion
In summary, Dogecoin’s fragile support and the URPD’s revelation of sparse lower-level activity position the cryptocurrency for potential volatility, with the $0.081 zone emerging as a critical buffer backed by historical accumulation. As market dynamics evolve in late 2025, staying attuned to on-chain indicators and technical patterns will be essential for navigating these risks. Investors are encouraged to evaluate their exposure and consider diversified approaches amid ongoing uncertainties.
Symmetrical Triangle Formation Signals Fragility
DOGE has formed a symmetrical triangle on the 12-hour chart. This pattern indicates a period of price compression within the current downtrend. Even though Dogecoin has bounced off the lower trendline a few times, trading volume remains low.
DOGEUSDT Price Chart / Source: X
This shows buyers aren’t strongly defending current prices, leaving the market exposed.On-chain data confirms that little historical buying exists immediately below the triangle.
If DOGE breaches the lower boundary, it may accelerate toward the $0.081 support cluster.The triangle’s formation, combined with sparse structural support, suggests volatility could increase.
Traders are expecting a rapid downward movement if the pattern resolves to the downside. Market participants should note that the first meaningful support lies substantially lower.
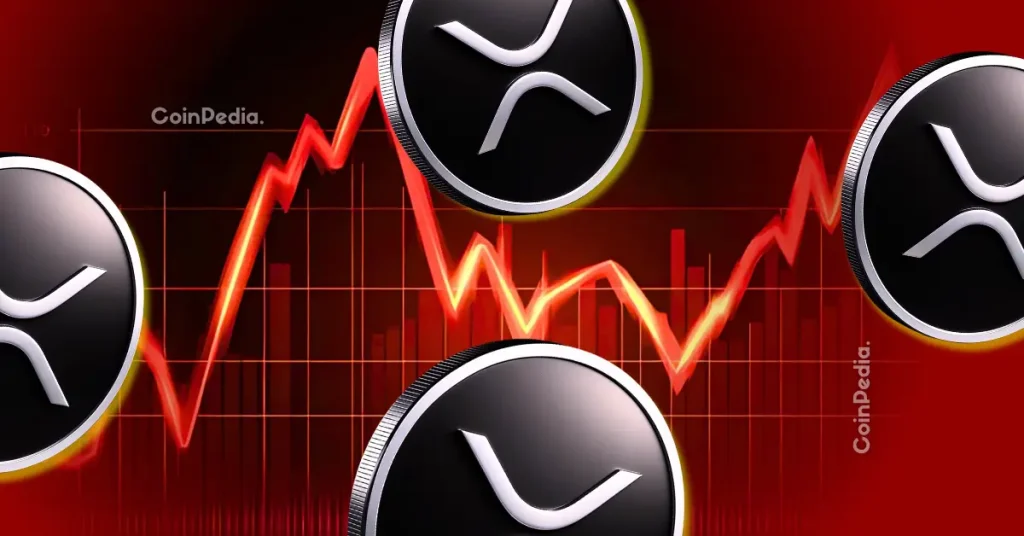
Volatile Price Action Reflects Shallow Support
Recent DOGE market behavior shows repeated rebounds with sharp pullbacks, reflecting reactive rather than confident buying. Early December saw a brief dip in market cap, followed by a recovery lacking depth. These moves indicate that current levels are weakly defended.
Price spikes around December 6th and 7th further illustrate how thin support can result in sudden losses. The absence of concentrated holders at current levels allows small sell-offs to cascade into larger declines. Analysts point out that the next substantial buffer exists only near $0.081.
Traders monitoring Dogecoin should note the combination of technical patterns and on-chain data. With historical accumulation concentrated at lower levels, DOGE remains exposed to rapid movements until stronger buyer clusters emerge.
Source: https://en.coinotag.com/dogecoins-fragile-support-may-lead-to-potential-drop-toward-0-081-zone