

Bitcoin Price Repeats 2021 Patterns, Whales, Shark Wallets on Decline
Bitcoin BTC $87 083 24h volatility: 0.5% Market cap: $1.74 T Vol. 24h: $35.93 B price weakness continues to persist as every bounce in recent weeks is met with instant selling pressure. As BTC is flirting with $87,000, on-chain data shows that total wallet addresses across sharks and whales are on a decline. This, coupled with Bitcoin ETF outflows, demonstrates that the overall sentiment is turning bearish.
Bitcoin Price Chart Repeats 2021 Pattern
Crypto market analyst Tracer has warned that Bitcoin may be repeating a price pattern similar to the 2021 cycle. In a recent post, the analyst pointed to a structure marked by a double top, followed by a sharp sell-off.
The image above also shows signs of a temporary rebound and another leg lower. Crypto analyst Tracer noted that many market participants could be unprepared for a renewed downside move. As per the above image, the Bitcoin price could see a temporary bounce to $100K. However, if the pattern repeats, it might crash later, all the way under $60K levels.
Furthermore, blockchain analytics firm Santiment has reported a shift in Bitcoin wallet distribution. According to the on-chain data, the number of wallets holding at least one Bitcoin has declined by 2.2% since reaching a one-year peak on March 3.
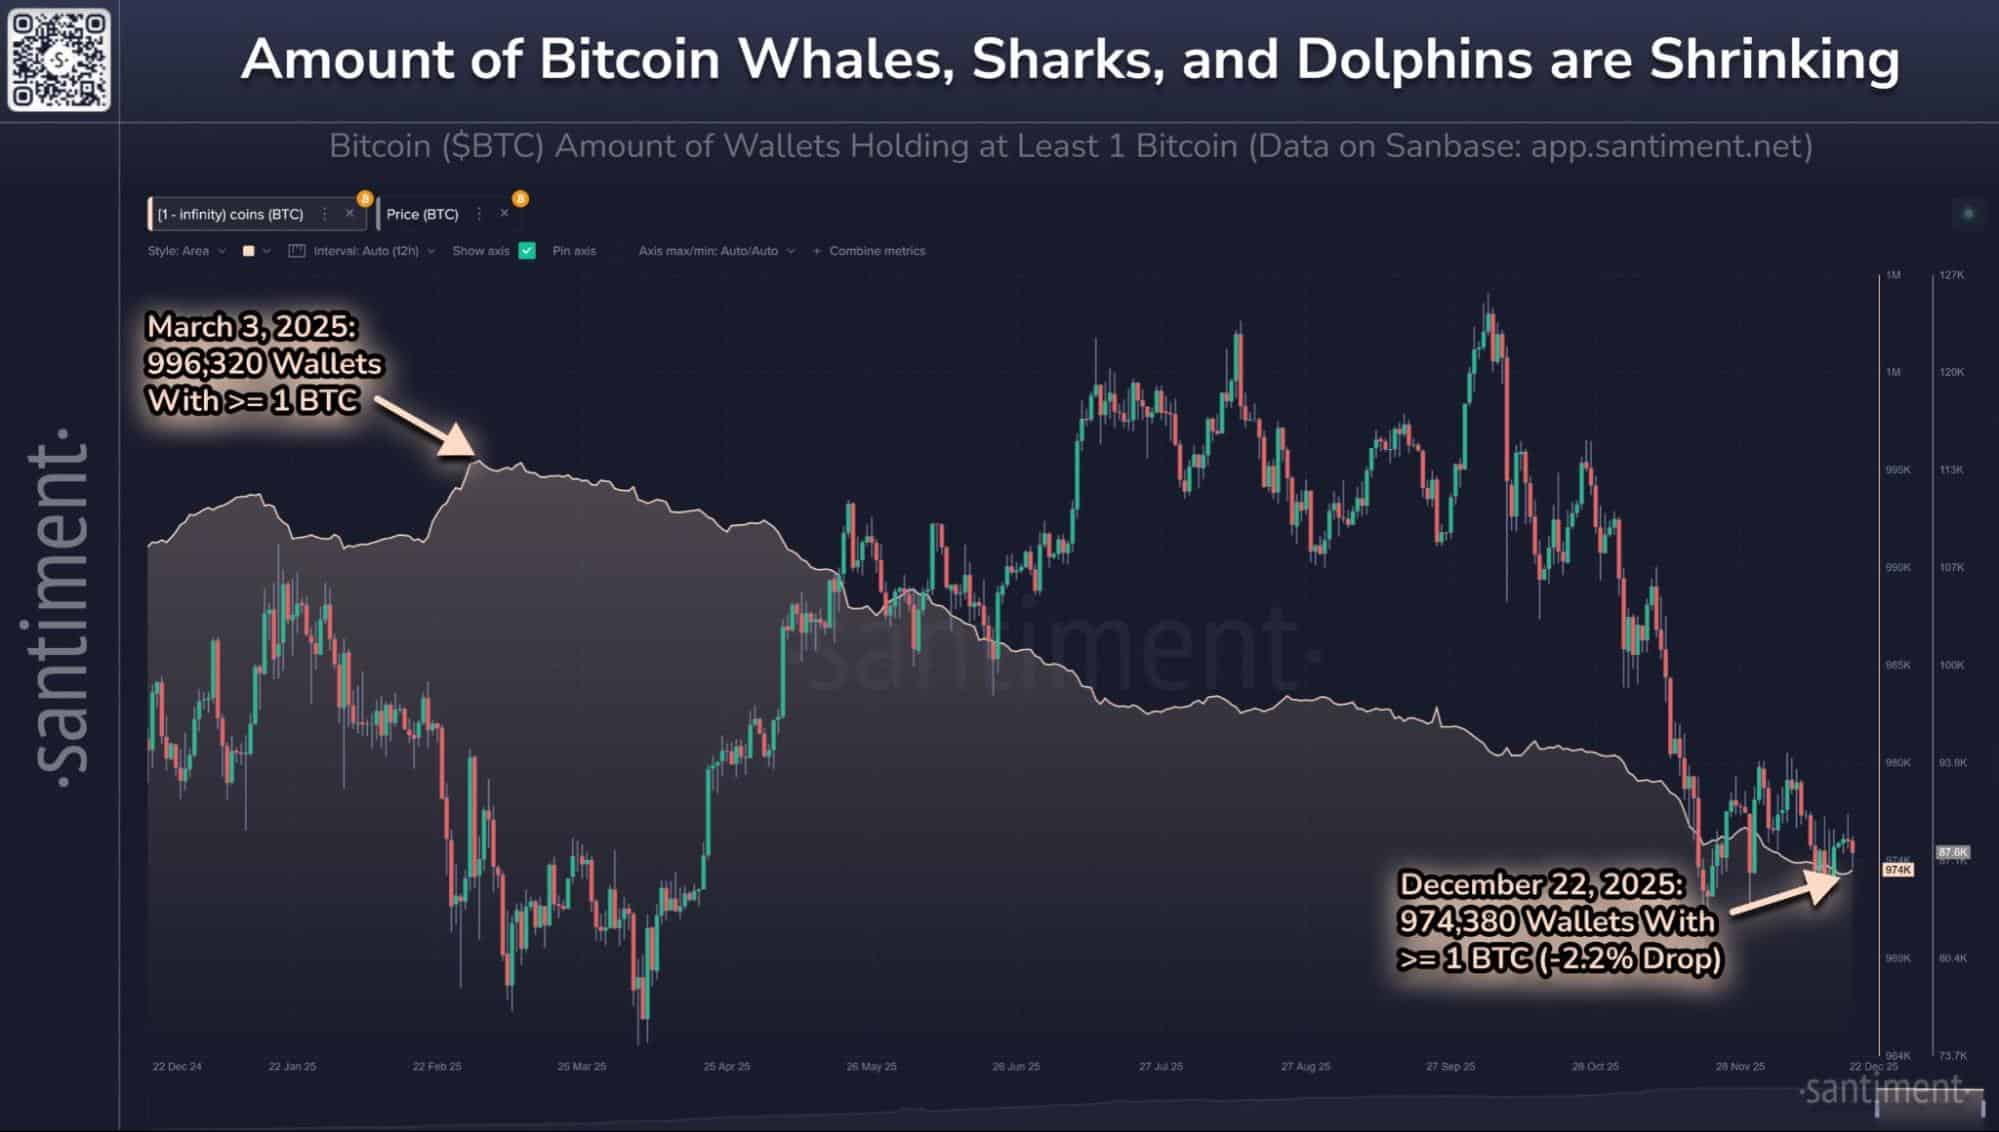
Bitcoin wallet data | Source: Santiment
However, Santiment noted one good thing. Wallets holding more than one Bitcoin have collectively increased their holdings by approximately 136,670 BTC over the same period.
After seeing a bounce to $90,000 earlier this week, BTC has once again faced rejection. It has shown a strong negative correlation with US tech stocks as well as top-performing metals like Gold and Silver.
Bitcoin ETFs Continue to Bleed
The US spot Bitcoin ETFs have seen major outflows over the past few trading sessions. After $497 million in outflows last week, this week the outflows have continued as well.
As data from Farside Investors shows, total outflows across all US Bitcoin ETFs have shot to $188 million. BlackRock iShares Bitcoin Trust (IBIT) recorded the most outflows at $157.3 million, with 1,792 Bitcoins moving out of the fund. The IBIT share price continues to flirt with $50.
nextThe post Bitcoin Price Repeats 2021 Patterns, Whales, Shark Wallets on Decline appeared first on Coinspeaker.
You May Also Like

Unleashing A New Era Of Seller Empowerment

Top cryptos to watch this Christmas: Bitcoin, Ethereum, XRP price predictions
