

Bitcoin today: breather phase below $92,000 as the market remains in controlled fear

At this moment, the Bitcoin market today shows a phase of breathing below $92,000, with short-term weakness but the overall picture still set to rise.
 EMA20, EMA50 and volumes”
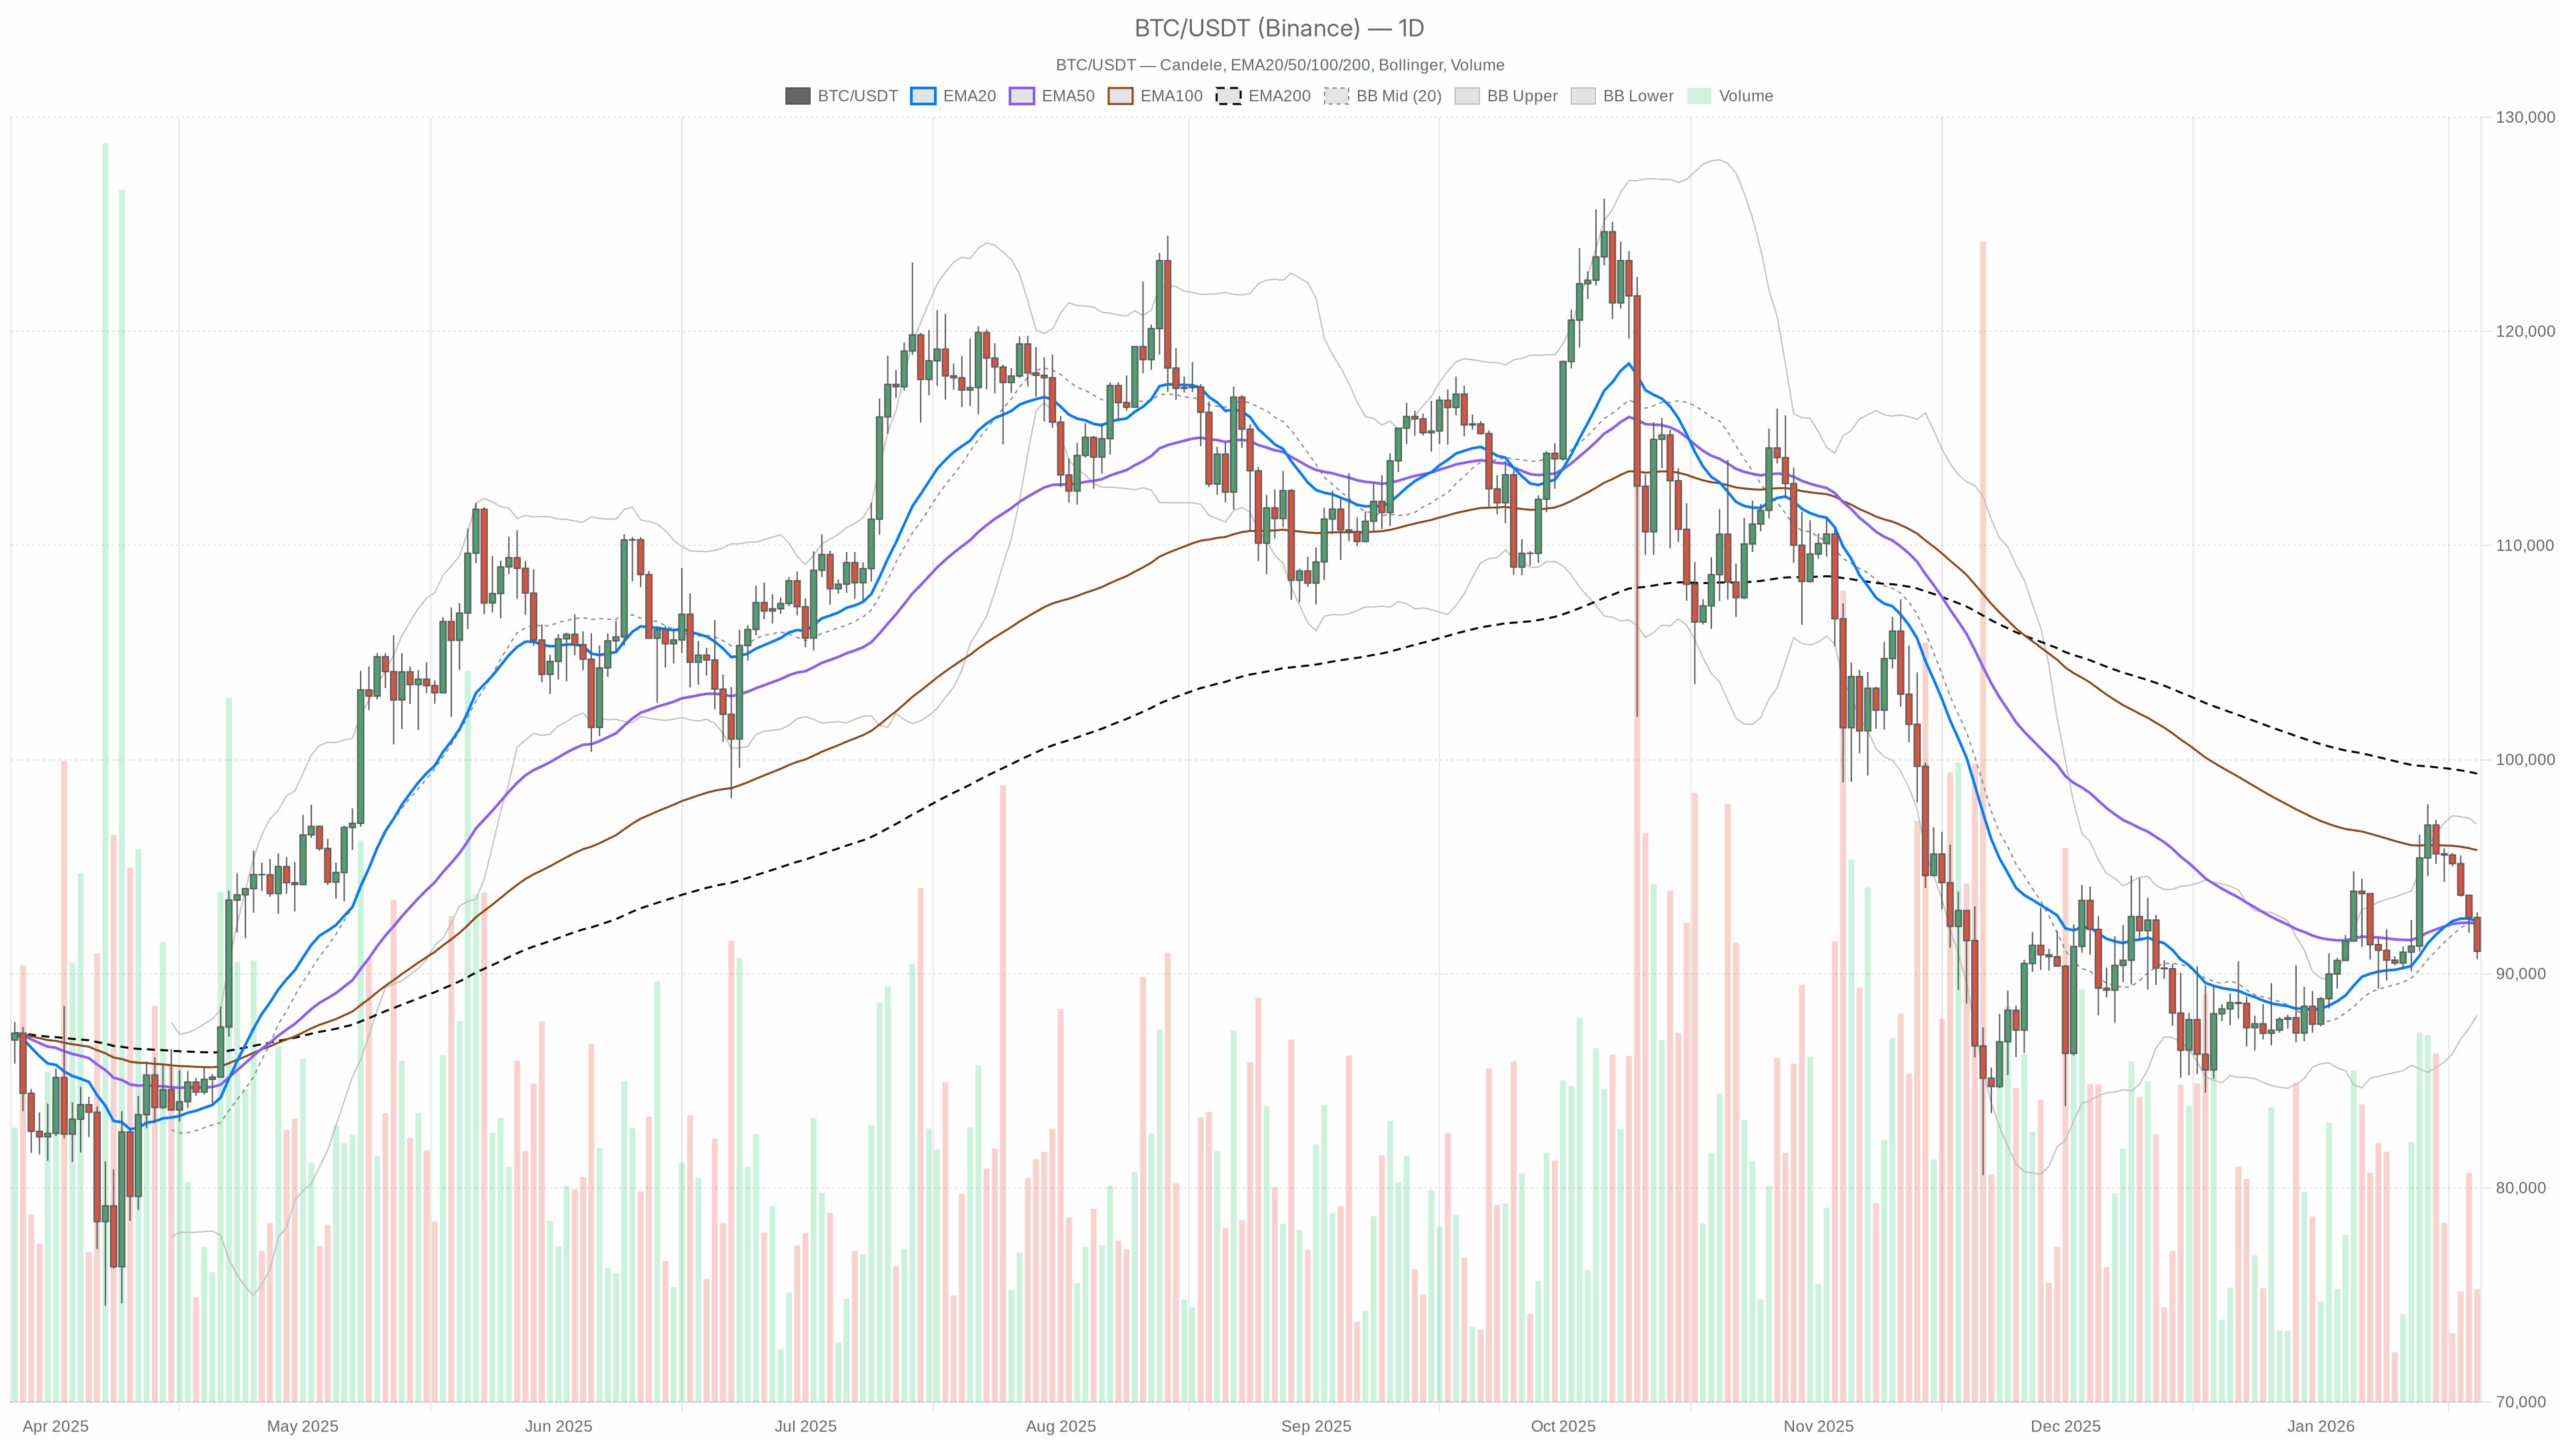
loading=”lazy” />BTC/USDT — daily chart with candles, EMA20/EMA50 and volumes.
Daily Context: Bitcoin today between $90,000 and $93,000, orderly but fragile breathing
On the daily (D1) timeframe, the price of Bitcoin today is moving around $91,054, slightly below the main daily pivot at $91,538. There is not yet a structural break in the underlying trend, but selling pressure is increasing compared to recent days.
Daily Moving Averages (EMA): price below the short-term, far from the long-term
- EMA 20 D1: $92,438.93
- EMA 50 D1: $92,338.20
- EMA 200 D1: $99,351.85
The price is slightly below the 20 and 50 daily averages, but has not yet decisively abandoned them. This suggests a loss of bullish momentum in the short term, rather than a true bearish trend. The distance from the EMA 200 above $99,000 indicates that the long-term trend remains upward, but we are in a zone of possible short-term distribution. As long as BTC stays below $92,500–$93,000, buyers are on the defensive.
Daily RSI: balance slightly tilted towards sellers
RSI 14 D1: 46.47
There is neither euphoria nor panic here: we are slightly below the full neutrality threshold. This indicates a market where selling pressure is doing its job, but without extremes. It is not a clear exhaustion point, more of a cooling of the trend after the recent rally.
Daily MACD: shortness of breath signal on the rise
- MACD Line: 969.84
- Signal Line: 1,100.91
- Histogram: -131.07
With the MACD line just below the signal line and a slightly negative histogram, we have a picture of bullish momentum in a discharge phase. It is not yet an aggressive decline, but a signal consistent with a market that is consolidating after running too fast.
Daily Bollinger Bands: central consolidation, moderate volatility
- Mid BB: $92,527.33
- Upper Band: $96,990.79
- Lower Band: $88,063.87
The price of Bitcoin today is just below the central band, in the middle of the $88,000–$97,000 range. This outlines a broad lateral phase after the previous rally. We are not compressing on the lower band, which would signal aggressive selling, but we are losing the upper part of the channel. In practice: medium consolidation, short-term bearish pressure.
Daily ATR: volatility in line with a “normal” correction
ATR 14 D1: $2,188.04
Average daily oscillations just above $2,000 are consistent but not extreme for BTC at these price levels. This means that 2–3% corrections in a single day fall within normality. The risk is real, but we are not yet seeing panic selling.
Daily Pivot Point: area $91,500 as short-term center
- Pivot (PP): $91,538.87
- Resistance R1: $92,384.74
- Support S1: $90,207.74
The Bitcoin value today is slightly below the daily pivot. This positioning reflects a more cautious intraday sentiment. The $90,200–$91,500 range is the corridor to watch: above the pivot, some confidence returns, while below S1, the risk is of accelerations towards the lower Bollinger band.
Short term: H1 and M15 show bearish pressure and local oversold
H1: short-term trend in the hands of sellers
On H1, BTC is quoted around $91,062 with a regime defined as bearish by the system.
Hourly Averages (H1): price crushed below all EMAs
- EMA 20 H1: $92,201.20
- EMA 50 H1: $93,133.39
- EMA 200 H1: $93,767.65
The price is below all key intraday averages, with a typical short-term bearish trend structure. As long as BTC remains below $92,200 on hourly close, every rebound risks being sold.
RSI H1: oversold, but without a decisive rebound yet
RSI 14 H1: 23.35
The picture here is clear: intense selling has brought the RSI into full oversold area. This opens the door to technical rebounds in the coming hours, but as long as the averages remain above the price, rebounds are to be considered counter-trend.
MACD H1: bearish momentum still active
- MACD Line: -622.69
- Signal Line: -488.52
- Histogram: -134.17
The MACD line is below the signal and the histogram remains negative: the selling momentum is still prevalent. The combination with a very low RSI indicates a phase where sellers dominate, but they also start to risk overdoing it in the very short term.
Bollinger Bands H1: price glued to the lower band
- Mid BB: $92,416.69
- Upper Band: $93,972.80
- Lower Band: $90,860.58
The price of BTC oscillates in the lower part of the channel, near the lower band. This confirms the intraday bearish pressure and increases the probability of false breakouts to the downside, with possible spikes below $90,800–$90,500 followed by rapid rebounds.
ATR H1: nervous but not explosive intraday range
ATR 14 H1: $462.38
Average hourly movements of almost $500 indicate a lively intraday market: enough movement for trading opportunities, but not yet capitulation conditions. Stops that are too tight risk being easily triggered.
Pivot H1: battle around $91,050
- Pivot (PP): $91,052.89
- R1: $91,124.99
- S1: $90,989.77
The quotation is practically glued to the hourly pivot. This highlights a phase of micro-equilibrium after the decline: the market is deciding whether to turn the correction into something more serious or to shake off short sellers with a rebound towards $91,500–$92,000.
M15: technical rebound hinted, but still within a weak context
On 15 minutes, the price is at $91,062, with the regime still assessed as bearish.
M15 Averages: price below all, but with signs of slowing descent
- EMA 20 M15: $91,391.74
- EMA 50 M15: $91,962.20
- EMA 200 M15: $93,195.30
Here too, the price remains below all major short-term averages. However, the distance is not extreme: this often anticipates lateral phases or small technical rebounds. To talk about an intraday reversal, at least a stable recovery above the 20 and then the 50, therefore above $91,400 and $92,000, would be needed.
RSI M15: weakness, but no longer in excess
RSI 14 M15: 37.05
Compared to H1, here we see a slight unloading of the oversold: sellers are slowing down, but control remains theirs. This is the typical context where the price can float upwards without real strength, leaving many traders in doubt.
MACD M15: first signs of slowing decline
- MACD Line: -349.69
- Signal Line: -368.99
- Histogram: 19.30
The histogram has turned slightly positive, indicating that the very short-term bearish momentum is losing strength. It is not a structural reversal signal, but of potential consolidation or small squeeze upwards.
Bollinger Bands M15: price approaching the average
- Mid BB: $91,375.48
- Upper Band: $92,212.75
- Lower Band: $90,538.20
The Bitcoin today 15-minute chart shows the price trying to rise towards the central band after a passage on the lower band. This confirms the stabilization attempt, but as long as we do not see closures above $91,400–$91,500, it remains a simple rebound in a weak trend.
ATR M15: high intraday noise
ATR 14 M15: $308.87
An average excursion over $300 in 15 minutes indicates a noisy operational context: those working with high leverage risk being thrown out by pure noise movements before the real movement takes direction.
Crypto market and sentiment: high BTC dominance, controlled fear
- Bitcoin Dominance: 57.5%
- Total Market Cap: ~3.159 trillion $
- 24h Market Cap Change: -2.18%
- Fear & Greed Index: 32 (Fear)
Bitcoin remains at the center of the market, with high dominance. Altcoins are suffering relatively more, typical of a moderate risk-off phase. The sentiment in fear, but not extreme, is consistent with the technical picture: profit-taking, stops on overly aggressive longs, but nothing yet resembling a generalized capitulation.
Bullish scenario for Bitcoin today
To talk about a plausible bullish scenario in the short term, a step-by-step path is needed:
- Step 1 (intraday): defense of the $90,200–$90,800 zone (S1 daily and lower band H1). Here buyers must stop the more aggressive bearish pushes.
- Step 2 (H1 confirmation): recovery and maintenance of the price above the H1 pivot at $91,050 and subsequent attack on $91,500–$92,000, with H1 RSI rising steadily above 40.
- Step 3 (daily validation): daily closure beyond $92,500–$93,000, i.e., above EMA 20/50 D1 and the central Bollinger band.
In this scenario, the price of BTC would transform the current phase into a simple pullback within a broader bullish trend. The next technical targets would become:
- Area $95,000–$97,000: upper part of the daily Bollinger channel.
- Psychological zone $100,000: near the EMA 200 D1 at about $99,350, a level that separates medium-term volatility from a potential new impulsive leg.
The invalidation of the bullish scenario would come with a decline and daily closure below $88,000–$88,500, corresponding to the lower Bollinger band daily. This would transform the pullback into a real structural change, opening space for a deeper correction.
Bearish scenario for Bitcoin today
The bearish scenario leverages the weakness already evident on short timeframes.
- As long as BTC remains below $92,200–$92,500 (EMA 20 H1 and daily pivot/R1 zone), every rebound risks being sold.
- A decisive break below $90,200 (S1 daily) with increasing volumes could trigger a slide towards $88,000–$88,500, where the lower Bollinger band D1 passes.
- If the general market sentiment were to deteriorate further, with crypto market cap falling over -5% daily and Fear & Greed in the 20 area, BTC could push towards a deeper support range in the $85,000–$86,000 area.
In this framework, the price of Bitcoin would cease to be a simple consolidation and become a post-rally distribution phase, with buyers forced to reposition lower.
The invalidation of the bearish scenario would instead come from a rapid recovery, accompanied by volumes, above $93,000 and a daily closure above the EMA 20/50, which would drastically reduce the downside potential and shift the bias towards the bullish scenario.
How to read the market context on BTC
Bitcoin is in that gray area that often causes more damage to traders than real crashes: underlying trend still healthy, but short-term in the hands of sellers. The daily speaks of orderly consolidation, while the intraday shows bearish pressure with local selling excesses.
What this implies, in practice:
- Short-term traders must accept that the current context favors false breakouts and volatility spikes, especially near $90,000–$90,500 and $92,000–$92,500.
- Position traders see a market that is simply cooling the rally: as long as daily closures remain above $88,000, the macro picture is not compromised.
- Entering aggressively with leverage in these zones means exposing oneself to the risk of being hit by market noise before the real movement takes direction.
In such a context, it makes more sense to let the price show its hand: either a clear recovery of short-term averages, thus a rebound scenario, or a clear break of key supports with volume confirmation, thus a structural decline scenario. Until then, a lot of movement and little clear direction.
If you want to monitor the markets in real-time with advanced charts and professional tools, you can open an account on Investing.com!:
Open your Investing.com account
This section contains a sponsored affiliate link. We may earn a commission but at no additional cost to you.
Disclaimer: The information contained in this article is for informational and educational purposes only and does not constitute financial advice or a solicitation to public savings. Trading in crypto markets involves a high level of risk: always carefully evaluate your risk profile and, if necessary, consult a qualified professional.
You May Also Like

Woman shot 5 times by DHS to stare down Trump at State of the Union address

CEO Sandeep Nailwal Shared Highlights About RWA on Polygon
