

Solana price finds support at $100 amid oversold RSI reading
Solana’s price is stabilizing at the $100 psychological level after an impulsive sell-off, with the RSI entering extreme oversold territory, signaling a potential relief bounce.
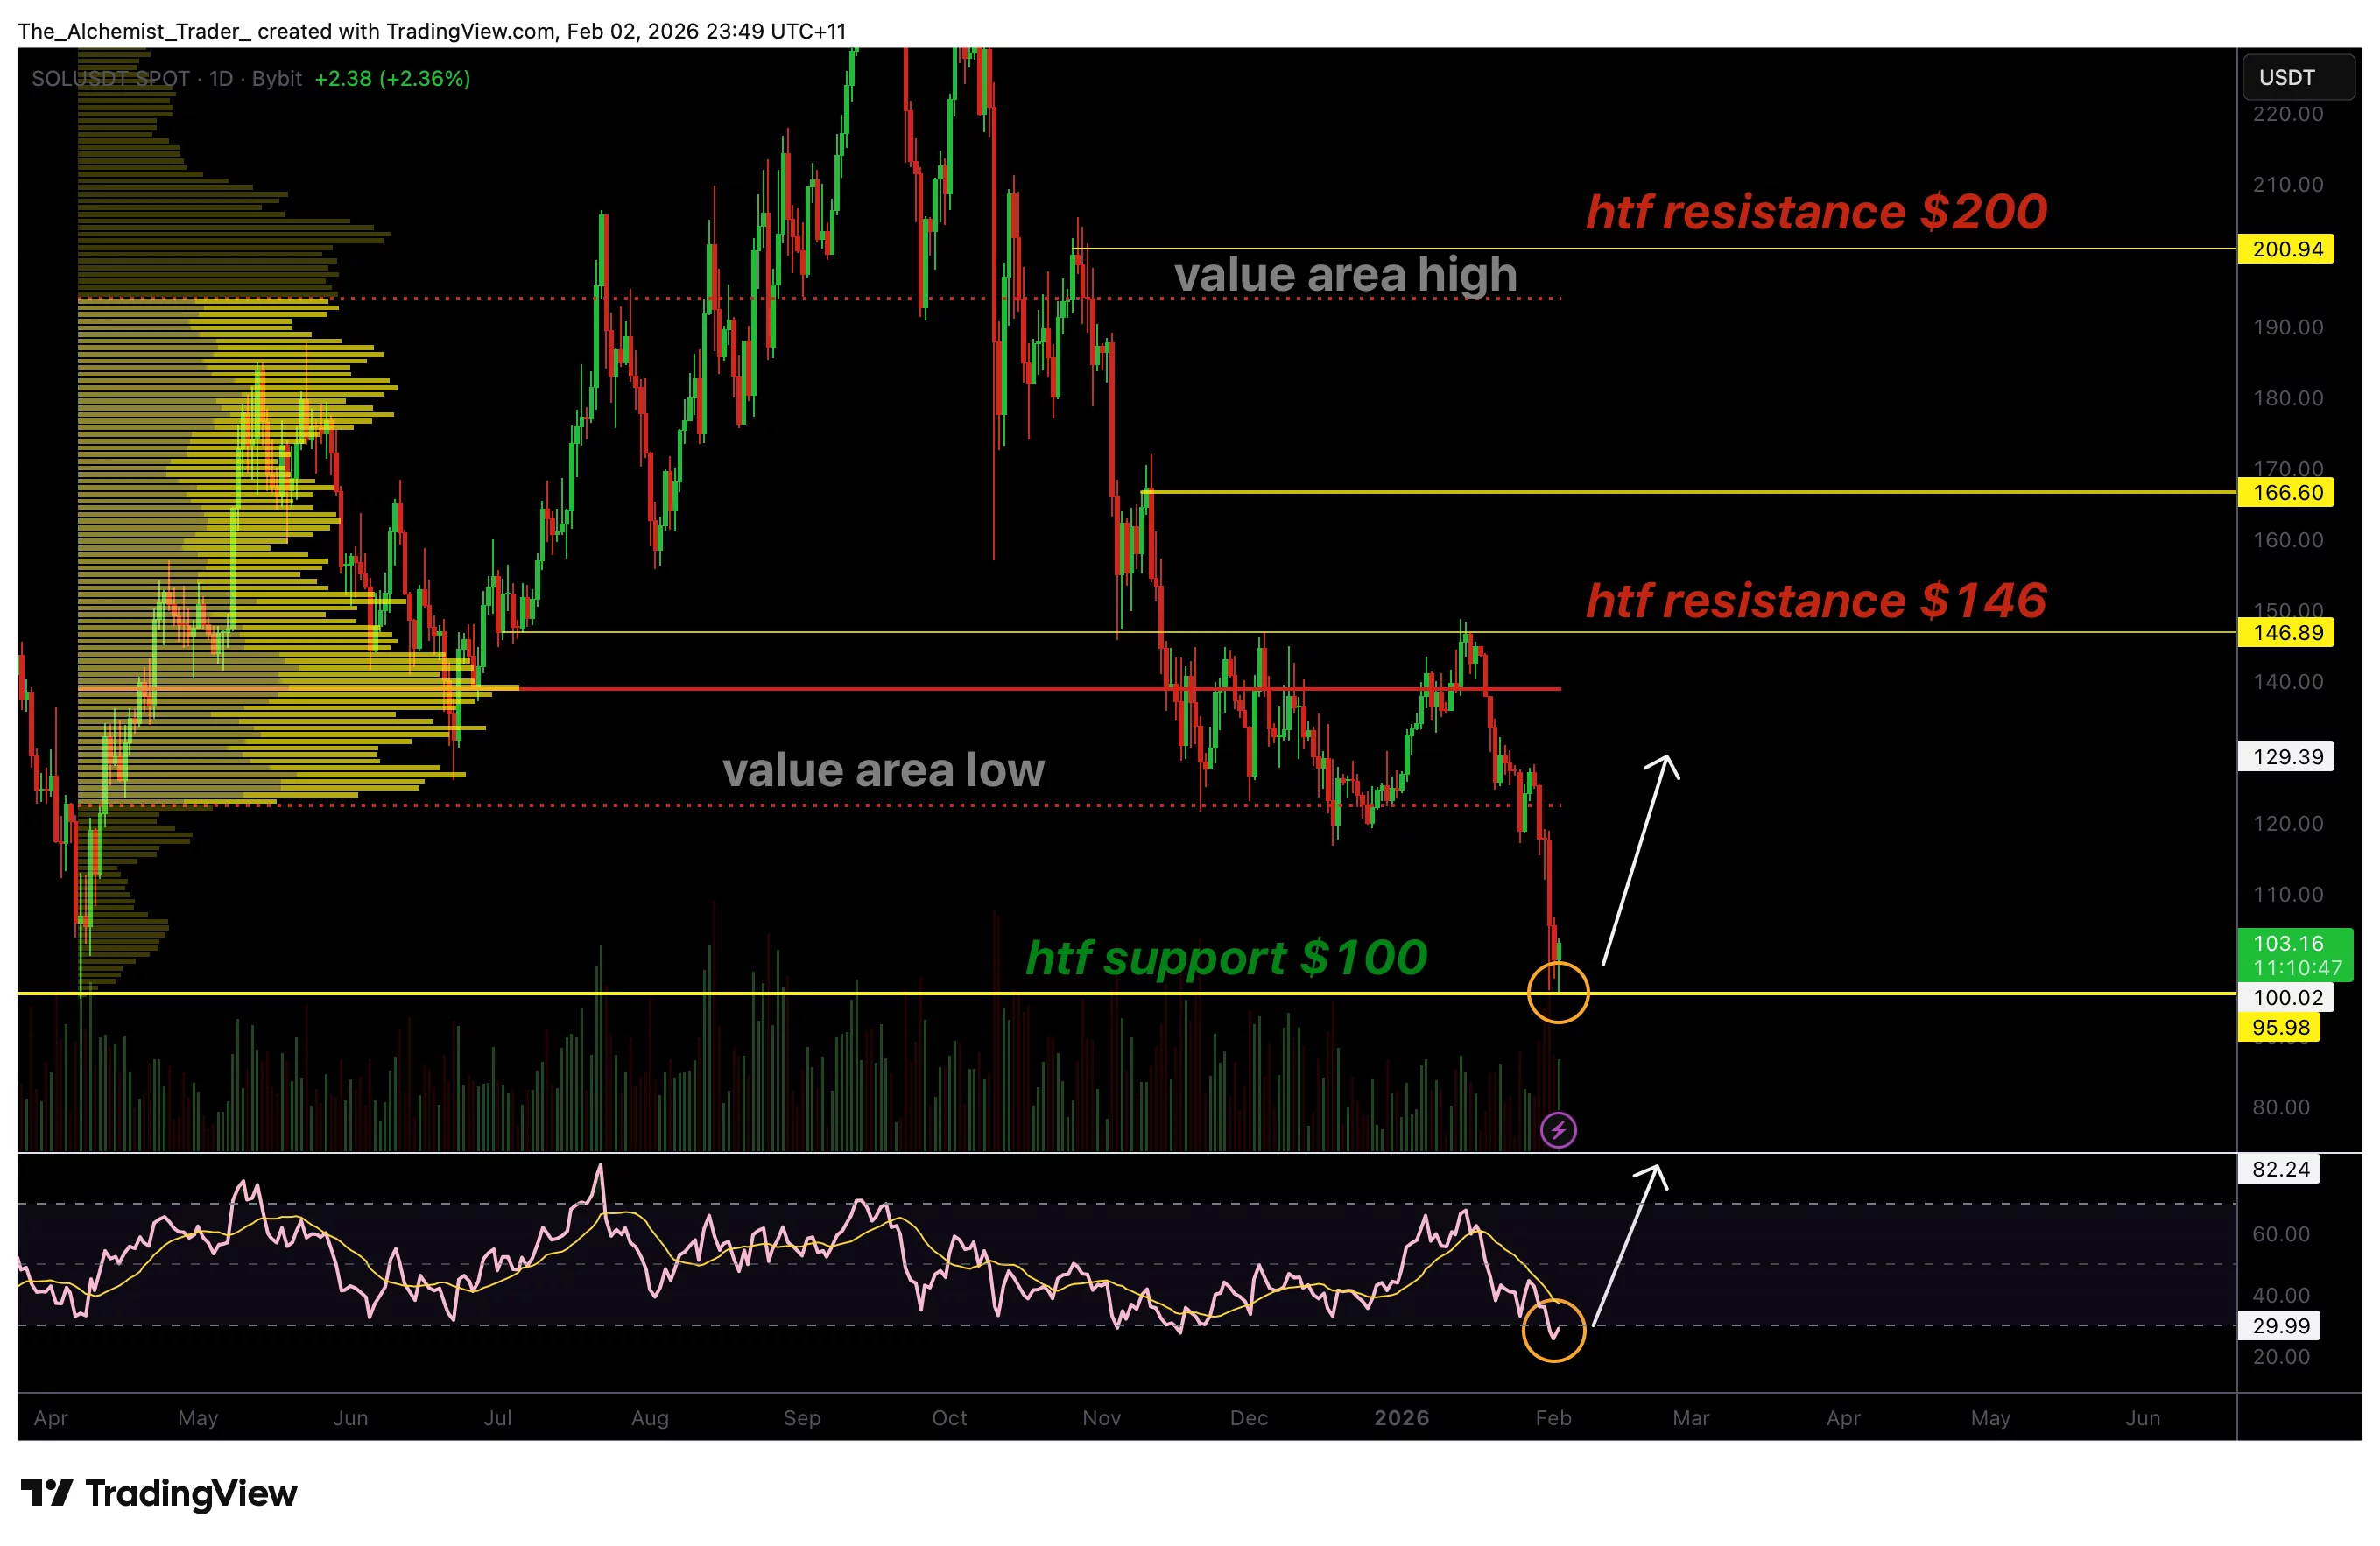
- Solana is defending the psychological $100 support after losing key volume and structure
- RSI below 30 signals extreme oversold conditions and bounce potential
- Any rally toward $146 is likely corrective unless structure and value are reclaimed
Solana (SOL) price has undergone a sharp and aggressive downside move, placing the asset firmly under bearish pressure across multiple timeframes. The recent decline has been characterized by impulsive selling, weak countertrend bounces, and a clear loss of bullish market structure.
As price accelerated lower, Solana invalidated several key technical levels, confirming that sellers remain in control of the broader trend.
While the overall structure remains weak, the current $100 test is occurring under materially different conditions, with momentum indicators now reflecting extreme exhaustion. This increases the likelihood of a short-term relief rally before the next major directional move unfolds.
Solana price key technical points
- $100 psychological support under pressure: Price is consolidating at a historically important demand zone.
- RSI below 30 signals oversold conditions: Momentum has reached extreme levels, often preceding relief rallies.
- $146 remains key high-timeframe resistance: Any bounce is likely to face heavy supply into this zone.
From a market structure perspective, Solana remains firmly bearish. The recent decline has produced consecutive lower lows and lower highs, reinforcing downside dominance and confirming that the broader trend has shifted against buyers. Importantly, Solana has lost acceptance below key volume-based levels, including the value area low, which historically acts as a pivot point between bullish and bearish control.
The loss of the value area low accelerated selling pressure, as price transitioned from a balanced auction environment into a trending bearish phase. Once this level failed to hold, downside liquidity was rapidly explored, driving price toward the next major area of interest at $100. This level stands out not only for its psychological significance but also because prior price reactions have led to strong bullish rotations.
During previous tests of the $100 region, Solana attracted sufficient demand to fuel rallies toward higher resistance levels. However, the current retest differs in context. This time, price is arriving at support after an extended impulsive decline, rather than following a controlled correction. This increases short-term risk but also raises the probability of exhaustion-driven reactions.
RSI oversold conditions and momentum exhaustion
One of the most important technical developments is the behavior of the Relative Strength Index (RSI). On the current test of $100, RSI has dropped below the 30 level, signaling extreme oversold conditions. Historically, RSI readings below 30 indicate that selling momentum has reached an unsustainable level, often preceding mean reversion or relief rallies.
While oversold conditions alone do not guarantee a trend reversal, they frequently lead to countertrend bounces as momentum normalizes. Eventually, RSI must return toward neutral territory, and this reversion process typically coincides with a short-term price recovery. In Solana’s case, this opens the door for a bounce higher, provided selling pressure begins to ease, and price holds above the $100 support zone.
It is important to note that oversold rallies are often corrective in nature rather than trend-changing. As such, any upside move from current levels should be viewed within the context of a broader bearish structure unless key resistance levels are reclaimed with strong volume and acceptance.
Upside levels and resistance to watch
If Solana successfully defends the $100 support and RSI begins to recover, the next upside objective sits near $146. This level represents a high-timeframe resistance zone and previously acted as a key rejection area during the broader decline. A move toward this level would align with a classic oversold relief rally, driven by short covering and momentum normalization rather than a full structural reversal.
However, the path toward $146 is unlikely to be smooth. Intermediate resistance zones and declining volume trends may cap upside attempts, particularly if bullish participation remains weak. For Solana to sustain a more meaningful recovery, buyers would need to reclaim lost value areas and demonstrate acceptance above prior breakdown levels.
What to expect in the coming price action
From a technical, price-action, and market-structure perspective, Solana is at a critical decision point. The $100 support level has merit in the short term due to extreme oversold conditions reflected in the RSI. This increases the probability of a relief rally as momentum reverts toward neutral territory.
You May Also Like

CEO Sandeep Nailwal Shared Highlights About RWA on Polygon

XRP Price Targets $1.65 Next, But BTC Correction Could Push It Down First
