Solana (SOL) Price: Can Bulls Defend $100 Support as Market Enters Extreme Fear?
TLDR
- Solana dropped to $95.87 during the recent market crash, testing the psychological $100 support level as Bitcoin fell toward $75,000
- Long liquidations hit $24.7 million out of $35.3 million total in 24 hours, with funding rates turning negative at -0.0057%
- Solana spot ETFs recorded first weekly outflows of $2.45 million since launch, showing weakening institutional interest
- Chaikin Money Flow shows bullish divergence near $96 support, suggesting large buyers are stepping in despite the 15.5% weekly decline
- SOL needs to reclaim $120.88 on a daily close to signal momentum shift, with potential targets at $128 and $148
The crypto market entered extreme fear territory as the Crypto Fear & Greed Index dropped to 14. Total market capitalization fell to $2.54 trillion, losing over $500 billion in recent days.
 Solana (SOL) Price
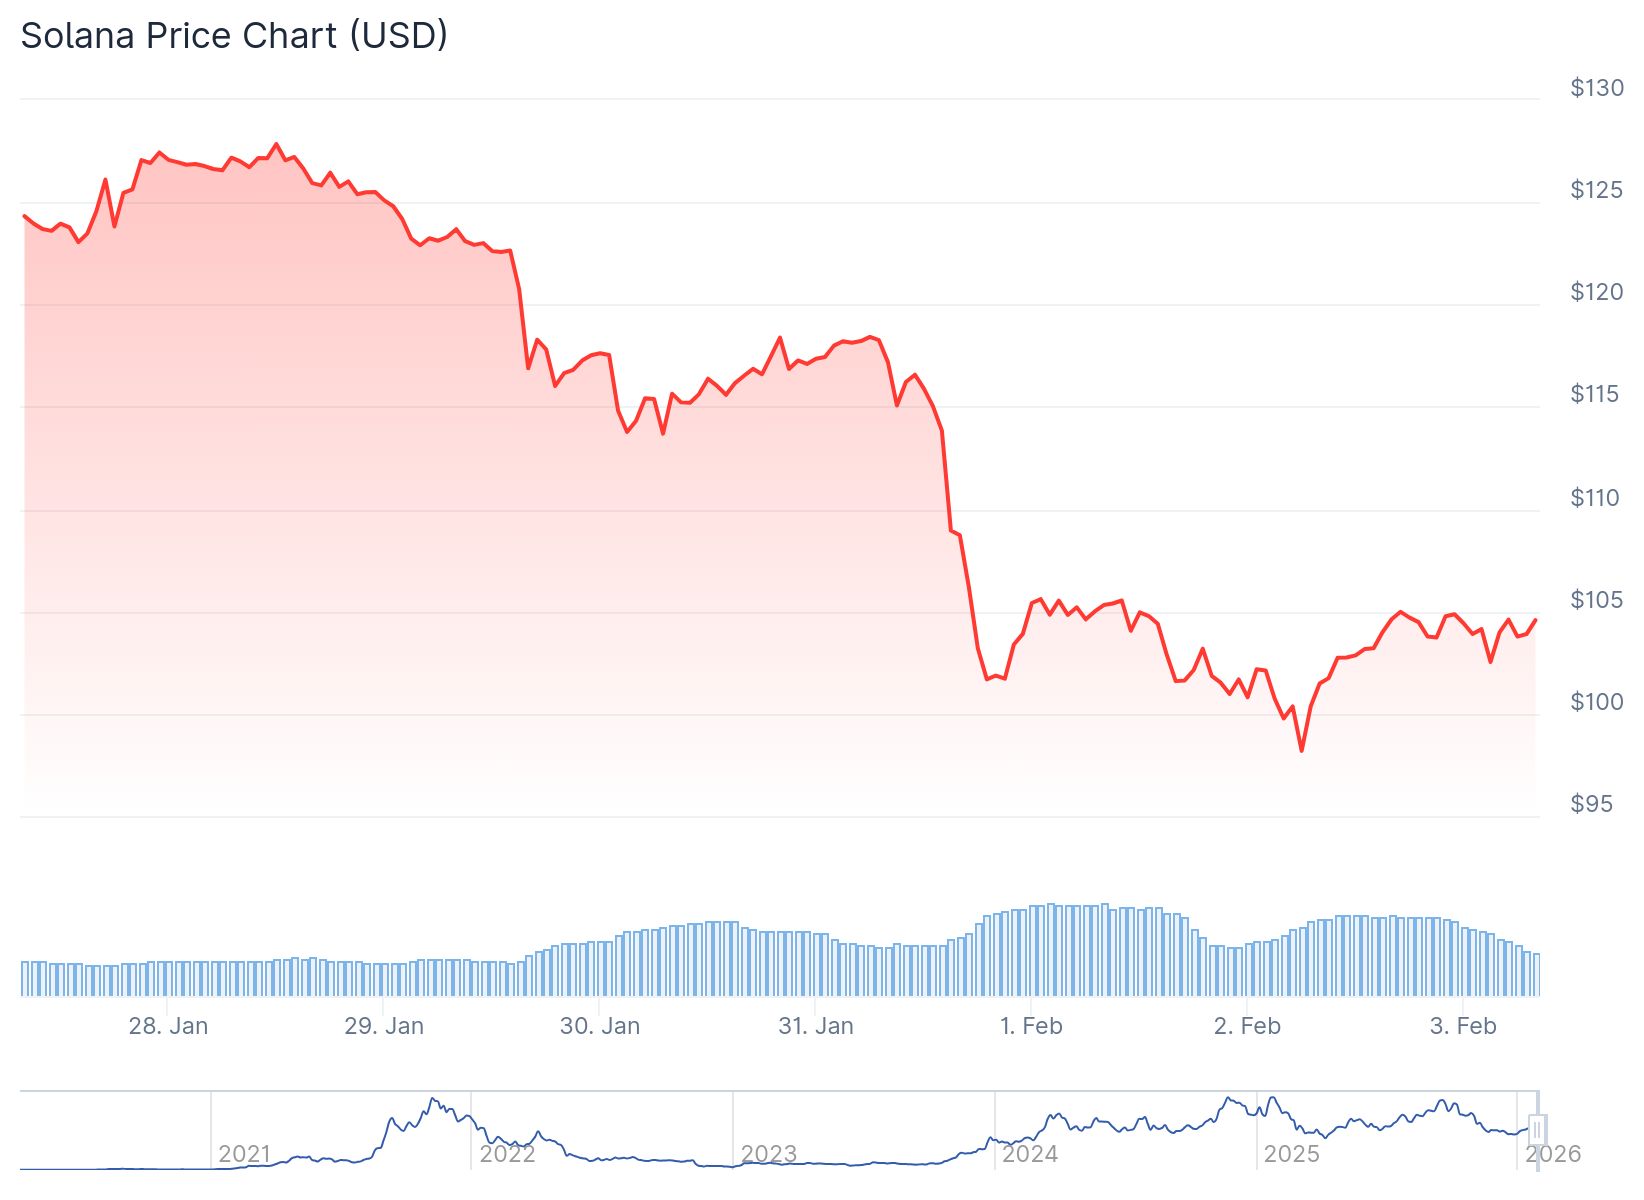
Solana faced heavy selling pressure during this downturn. The altcoin tested the $100 psychological support level as Bitcoin slid toward $75,000.
SOL reached a low of $95.87 before finding support. The price has since recovered to around $103-$105, gaining approximately 3-8% from the bottom.
Liquidation data from Coinglass shows the selling intensity. Solana faced $35.3 million in total liquidations over 24 hours. Long positions accounted for $24.7 million of these liquidations.
 Source: Coinglass
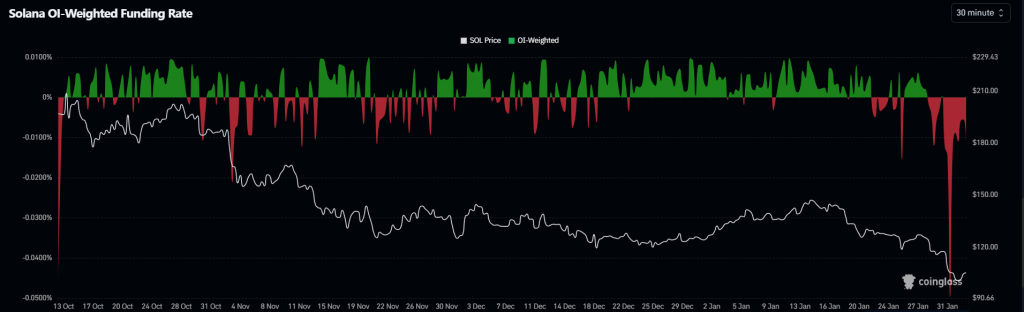
The funding rate for Solana futures turned negative at -0.0057%. This indicates more traders are betting on further downside. Short sellers are now paying long traders, a bearish signal.
The long-to-short ratio sits at 0.94. A ratio below 1 means more traders expect prices to fall than rise.
Institutional Money Shows Signs of Retreat
Institutional interest appears to be cooling. According to SoSoValue, Solana spot ETFs saw net outflows of $2.45 million last week. These were the first weekly withdrawals since the ETFs launched.
Continued outflows could add downside pressure in the near term. However, on-chain data reveals a more complex picture.
The Chaikin Money Flow indicator shows a bullish divergence. While SOL’s price fell from late January through early February, CMF moved higher. This suggests large investors were accumulating near the $95-$96 zone.
CMF measures capital flows using price and volume. Rising CMF during a price decline indicates that whales or institutions view current levels as attractive.
Long-Term Holders Remain Patient
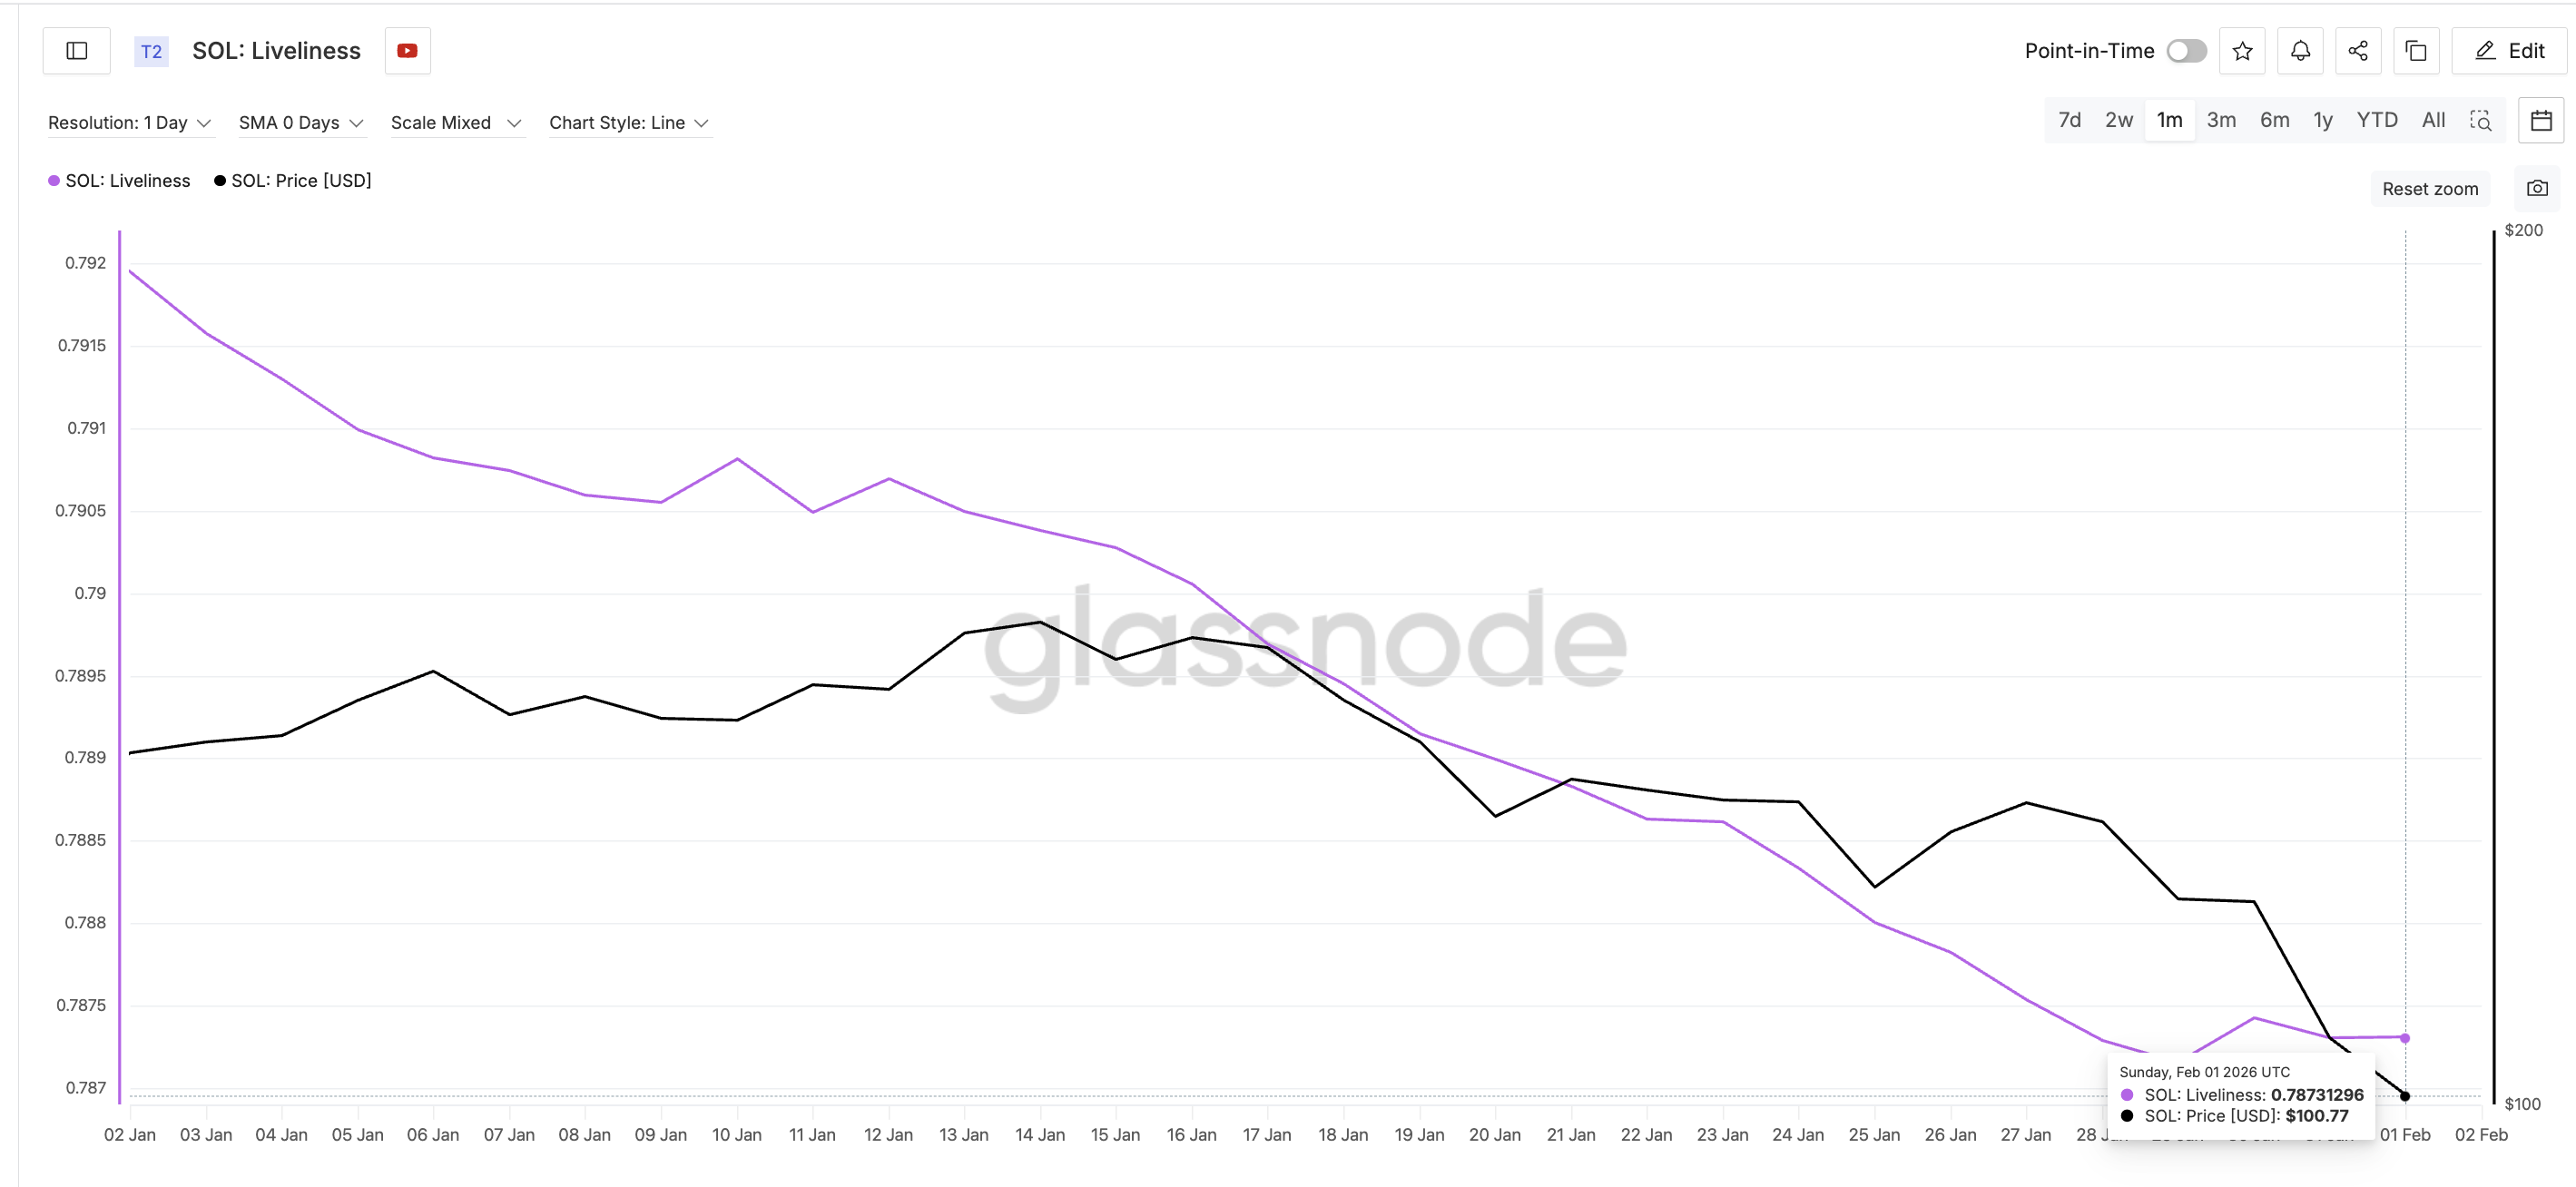
Liveliness data shows long-term holders did not panic sell. Liveliness measures how often long-held coins are spent. When it rises, long-term holders are selling. When it falls, they are holding.
 Source: Glassnode
Solana’s liveliness trended lower over the past month. Even during the sharp drop from $127 to below $100, liveliness remained subdued. This suggests long-term investors view the decline as temporary.
However, short-term activity increased. The 1-day to 1-week holder cohort grew from 4.38% to 5.26% between December 31 and February 1. These short-term traders add volatility and could limit rally potential.
SOL broke below a trading range between $117 and $147 in late January. The breakdown followed a head-and-shoulders pattern with a target near $95-$96. That target was reached almost perfectly at $95.87.
Critical Price Levels to Watch
The $95-$96 zone now serves as key support. As long as SOL holds above this area, the rebound structure stays intact. A break below $95 could open the door to $80 or even $77.
On the upside, $103.60 represents the first near-term resistance. Solana is currently testing this level.
The most important resistance sits at $120.88. This level marked a breakdown point on January 29. It also aligns with the 20-day exponential moving average.
A daily close above $120.88 would signal that buyers are regaining control. It would indicate the correction phase may be ending. Above $120, the next targets sit at $128.29 and $148.63.
The recovery depends on continued capital inflows and stable long-term holder behavior. If CMF crosses above zero, it would confirm buying pressure is outweighing selling. Short-term trader dominance could stall rallies before reaching higher targets.
SOL currently trades at $103-$105, recovering from the $95.87 low as buyers defend the $100 psychological support level.
The post Solana (SOL) Price: Can Bulls Defend $100 Support as Market Enters Extreme Fear? appeared first on CoinCentral.
You May Also Like

A Netflix ‘KPop Demon Hunters’ Short Film Has Been Rated For Release

Trump foe devises plan to starve him of what he 'craves' most