

USDT Is Leaving Exchanges at a Record Rate: Here Is What That Means for the Market
Tether withdrawal transactions from centralised exchanges have surged to an all-time high of 54,000 daily transactions, while deposit transactions sit at just 11,000, creating the largest imbalance in USDT exchange flow ever recorded, according to CryptoQuant data.
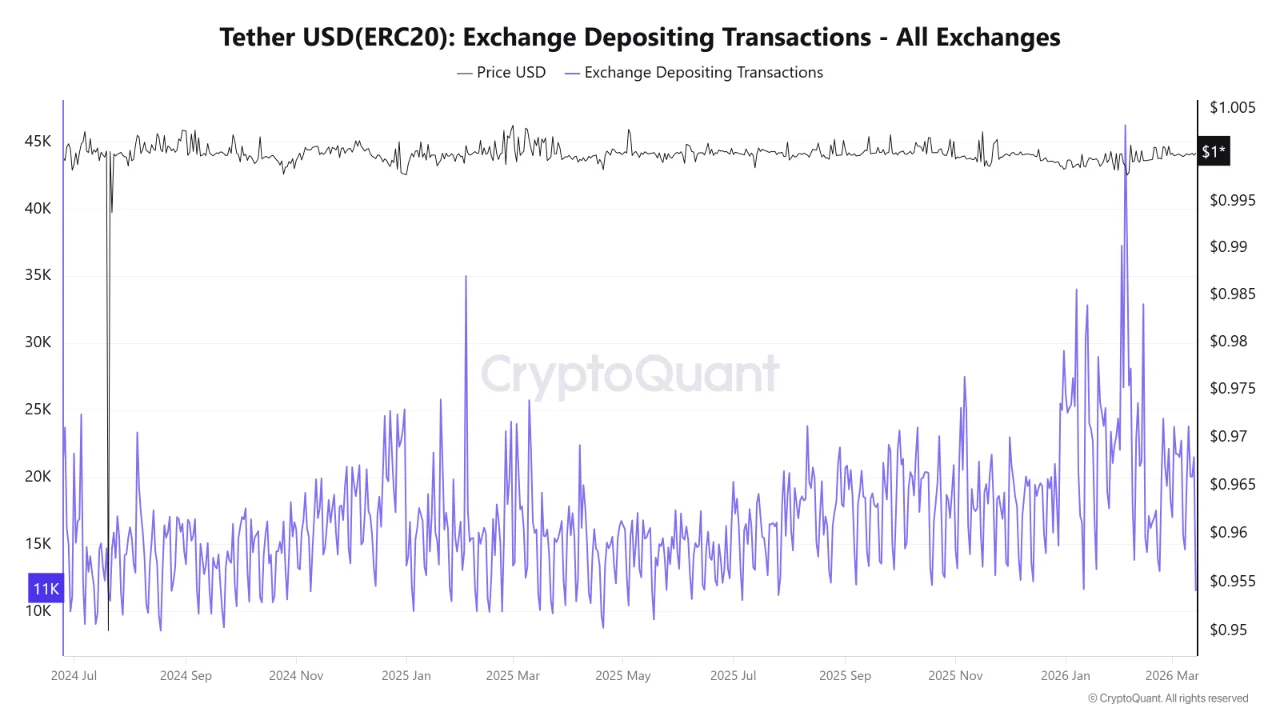
What the Charts Show
The depositing transactions chart covers July 2024 through March 2026, tracking how many times USDT is being sent to exchanges daily. The line has remained relatively flat throughout the entire period, oscillating between 10,000 and 45,000 with occasional spikes. The current reading sits at 11,000, near the lower end of that historical range. Capital moving onto exchanges for deployment has not accelerated.
 The active addresses chart tells a different story. USDT active addresses on Ethereum have surged to approximately 340,000, near all-time highs for the metric. The purple line has been climbing consistently since mid-2024 and accelerated sharply into early 2026. High active addresses mean more wallets are interacting with USDT, but those interactions are predominantly withdrawals rather than deposits.
The exchange reserve chart provides the result of those two flows combined. USDT reserves across all exchanges peaked near $60 billion in early 2026 before falling to the current $50.6 billion. That $9.4 billion reduction in exchange-held USDT represents capital that has left centralised platforms. It peaked precisely as Bitcoin hit its $126,000 all-time high and has been declining since.
What 54,000 Withdrawals Against 11,000 Deposits Means
The ratio is nearly five to one. For every USDT being moved onto an exchange for trading, nearly five are being moved off. That imbalance at this scale has not appeared before in the dataset.
Two interpretations exist and both may be simultaneously true. The first is anxiety-driven capital flight. Geopolitical instability around the Iran conflict, covered extensively this week, is pushing investors to move USDT into private custody or off-exchange storage rather than leaving it exposed on centralised platforms. The second is strategic positioning. Capital moving off exchanges into self-custody wallets is being held in reserve, war chests in the framing used in the analysis, waiting to be deployed when conditions improve.
The distinction matters for what comes next. Anxious capital that has permanently exited the ecosystem reduces available buying power. Strategic capital sitting in private wallets represents latent demand that can return rapidly when sentiment shifts.
The Liquidity Crunch Mechanism
Exchange-side liquidity is what allows large buy and sell orders to be executed without moving price significantly. When USDT reserves on exchanges fall from $60 billion to $50.6 billion, the depth of order books decreases. Less stablecoin on exchanges means less immediate buying power available to absorb sell orders, and less depth to support large purchases without significant price impact.
That dynamic makes markets more volatile in both directions. A large sell order hits thinner books and moves price more. A large buy order also moves price more. The $9.4 billion reduction in exchange USDT reserves since the peak is a structural reduction in market depth that amplifies price movements regardless of direction.
How This Connects to the Week’s Data
The stablecoin netflow data covered earlier this week showed Binance running a monthly USDT outflow of approximately negative $2 billion. The USDT withdrawal record of 54,000 daily transactions is the transaction-level expression of that same trend. Capital is leaving exchanges at a historically unprecedented rate in terms of transaction count, even as the total reserve decline of $9.4 billion suggests the average withdrawal size has also been large.
The active address surge to 340,000 confirms the capital is not disappearing. It is moving. Where it goes next, back onto exchanges as buyers or further into private storage as fearful holders wait out the uncertainty, is the question the data cannot answer. The record withdrawal rate tells you the direction of current flow. It does not tell you when that flow reverses.
The post USDT Is Leaving Exchanges at a Record Rate: Here Is What That Means for the Market appeared first on ETHNews.
You May Also Like

Bitcoin Could Surge to $95,894, Analyst Makes Bold Prediction

Egrag Crypto: XRP Could be Around $6 or $7 by Mid-November Based on this Analysis
