

Ripple Price Today: XRP/USDT Holds a Fragile Bullish Bias Above $1.45

While the broader crypto market trades under extreme fear, Ripple price today shows XRP holding firm above nearby support and trying to extend its recent rebound.
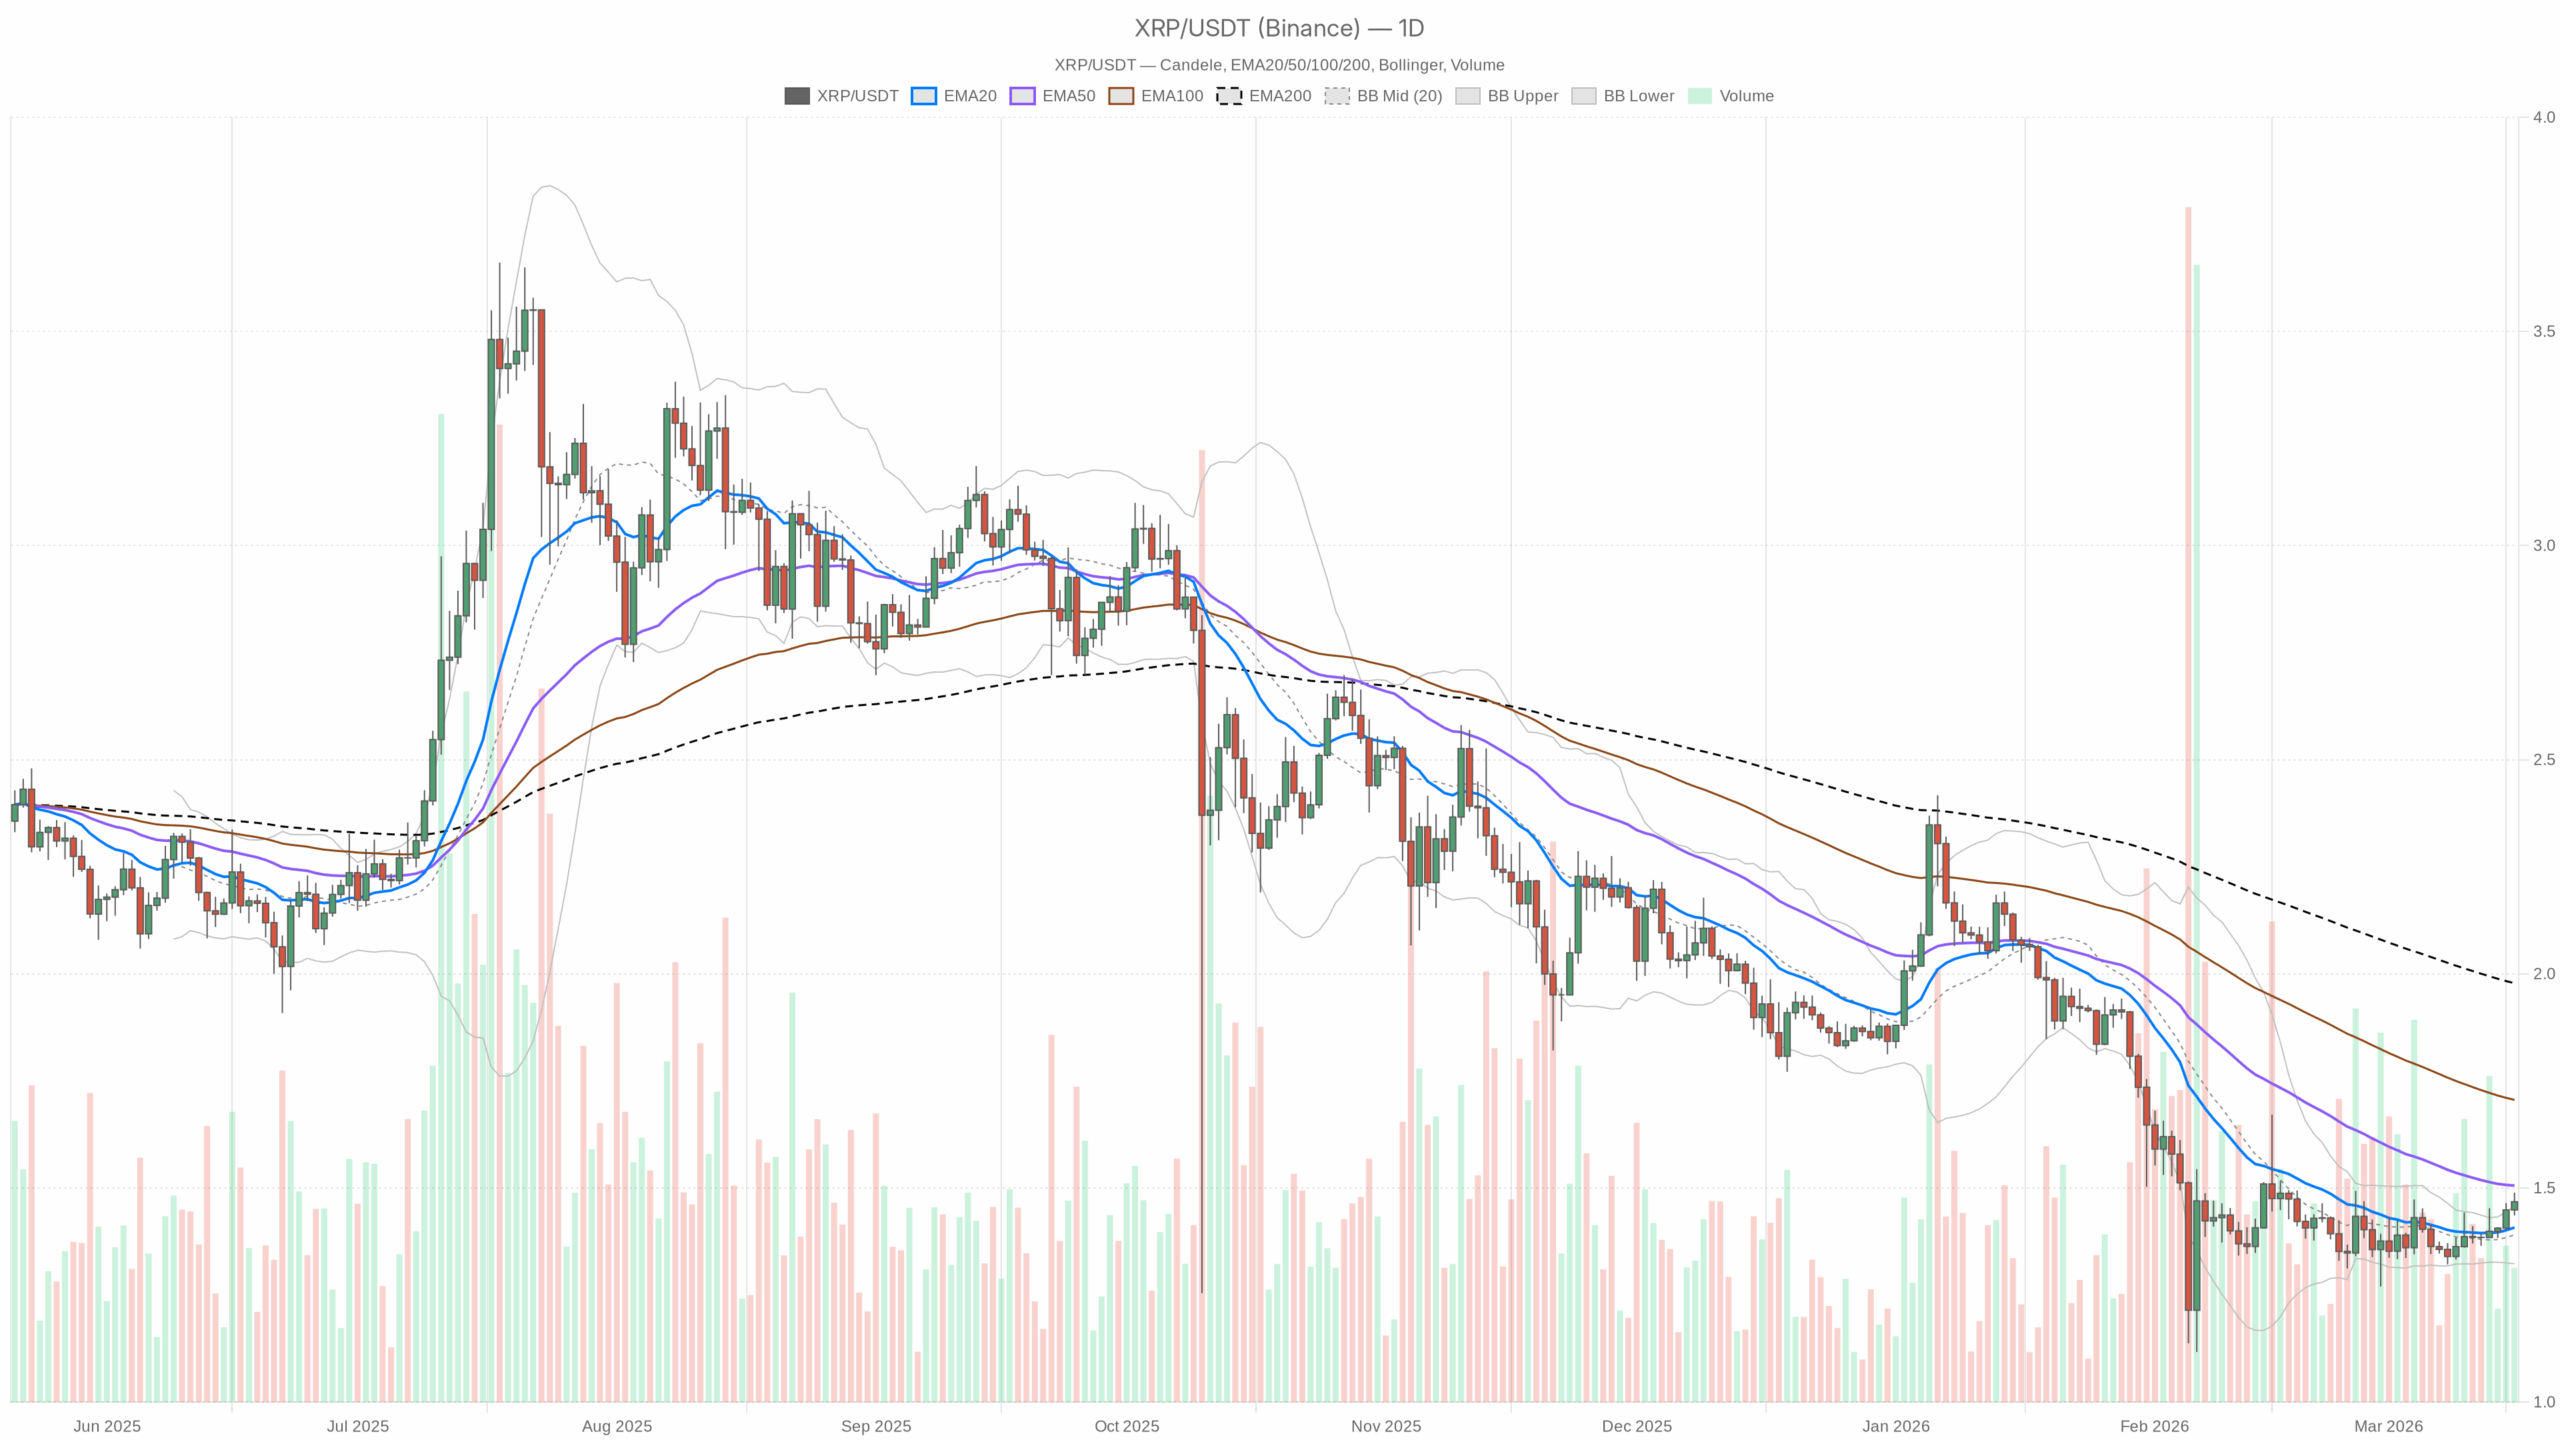 XRP/USDT — daily chart with candlesticks, EMA20/EMA50 and volume.
Daily Chart (D1): Macro Bias – Cautiously Bullish, But Not Out of the Woods
On the daily timeframe, XRPUSDT closed at $1.47 with the system tagging the regime as neutral. In practice, price action looks slightly better than that label: buyers have reclaimed short-term territory, but have not broken the larger downtrend.
EMAs (Trend Structure)
– Price: $1.47
– EMA 20: $1.41
– EMA 50: $1.51
– EMA 200: $1.98
Price is trading above the 20-day EMA but below both the 50-day and 200-day EMAs. In simple terms, the short-term trend has turned up, while the medium and long-term trends remain down.
What it implies: bulls have won the last few weeks, but they are still fighting inside a larger bearish structure. As long as XRP stays above the 20-day EMA (~$1.41), the short-term rebound remains intact. The real battleground ahead is the 50-day EMA (~$1.51); reclaiming and holding above that would be the first serious sign of a trend transition rather than just a bounce.
RSI (Momentum)
– RSI 14: 56.34
RSI has moved into the upper neutral zone, leaning slightly bullish but far from overbought.
What it implies: momentum has shifted in favor of buyers, but there is no sign of euphoria or exhaustion. The market has room to push higher before running into traditional overbought territory, which keeps the door open for further upside if buyers stay active.
MACD (Trend/Momentum Confirmation)
– MACD line: -0.01
– Signal line: -0.03
– Histogram: 0.02
The MACD line is slightly above the signal line, with a positive histogram, but both are still in negative territory overall.
What it implies: the trend is in the early phase of a bullish crossover after a bearish period. Bulls have gained short-term control, but the longer backdrop is still recovering from prior weakness. This fits with the EMA picture: emerging strength, not yet a full-on daily uptrend.
Bollinger Bands (Volatility & Positioning)
– Middle band (20-day basis): $1.39
– Upper band: $1.46
– Lower band: $1.32
– Close: $1.47 (slightly above the upper band)
XRP is trading just above the upper Bollinger Band, with the band width still relatively contained.
What it implies: price pressing through the upper band shows persistent buying pressure in the short term. Because volatility is not blown out, this looks more like a controlled grind higher than a blow-off spike. Still, being above the upper band often comes with a risk of mean reversion back toward the mid-band (~$1.39) if buyers lose steam.
ATR (Daily Volatility)
– ATR 14: $0.06
Daily volatility is modest relative to price, at about 4% of spot.
What it implies: the market is not in a panic phase. Swings are tradable without being wild, which can encourage short-term traders to lean into breakouts or pullbacks with defined risk. A sudden spike in ATR from here would likely signal a new phase of aggression from either bulls or bears.
Daily Pivot Levels
– Pivot Point (PP): $1.46
– R1: $1.49
– S1: $1.44
XRP is hovering slightly above the daily pivot at $1.46, within reach of R1 at $1.49 and with S1 at $1.44 acting as immediate nearby support.
What it implies: intraday flows are balanced just above equilibrium. Holding above $1.46 keeps the intraday tone constructive. A clean push and acceptance above $1.49 would likely invite a new leg higher, while a drop back under $1.44 would tell us buyers are backing off.
Daily verdict: the main scenario is cautiously bullish as long as XRP holds above the 20-day EMA and the $1.44–1.46 support band. The higher timeframe downtrend is not broken, but short-term forces are currently on the bull side.
1-Hour Chart (H1): Short-Term Flow – Bulls in Control, But Close to Short-Term Stretch
On the 1-hour chart, the regime reads bullish, and the structure backs that up.
EMAs (Intraday Trend)
– Price: $1.47
– EMA 20: $1.45
– EMA 50: $1.43
– EMA 200: $1.40
Price is trading above all major intraday EMAs, with the EMAs stacked in bullish order (20 > 50 > 200).
What it implies: the intraday trend is firmly up. Dips toward $1.45–1.43 are currently pullback zones rather than breakdowns. As long as price respects the 20- and 50-hour EMAs, momentum traders will keep leaning long on weakness.
RSI (Intraday Momentum)
– RSI 14: 63.83
RSI on H1 is pushing into the bullish but not extreme zone.
What it implies: buyers are clearly in charge intraday, but the market is approaching the kind of levels where short-term overextension can start to appear. It still leaves some room for continuation, yet chasing at market becomes riskier if RSI keeps climbing without a consolidation.
MACD (Intraday Confirmation)
– MACD line: 0.02
– Signal line: 0.01
– Histogram: 0.00 (flat/very small)
The MACD line is slightly above the signal with a nearly flat histogram.
What it implies: the intraday uptrend is intact but momentum is no longer accelerating. Bulls have control, but the move is maturing. This often precedes either a sideways consolidation or a shallow pullback before the next directional decision.
Bollinger Bands (H1)
– Middle band: $1.44
– Upper band: $1.50
– Lower band: $1.39
– Close: $1.47
Price is trading in the upper half of the band, below the upper band.
What it implies: XRP is in the bullish side of its intraday range, but not at a blowout extreme. There is still breathing room for a push into $1.49–1.50 before bands become a strong magnet for mean reversion.
ATR (H1 Volatility)
– ATR 14: $0.02
Hourly volatility is modest, roughly a 1.3% move per ATR.
What it implies: the tape is orderly. Breakouts and breakdowns on this timeframe are likely to be incremental rather than explosive unless volume suddenly surges.
Hourly Pivot
– Pivot Point (PP): $1.47
– R1: $1.47
– S1: $1.47
The pivot levels are clustered exactly at current price, reflecting a very tight, balanced calculation.
What it implies: the market is currently pivoting right at fair value intraday. The next clear directional clue will come from whether price starts building time and volume above $1.47–1.48 or slipping back below $1.47 toward the mid-band at $1.44.
15-Minute Chart (M15): Execution Context – Paused After the Push
The 15-minute regime is marked as neutral, showing that the short-term move has taken a breather.
EMAs (Micro Trend)
– Price: $1.47
– EMA 20: $1.47
– EMA 50: $1.46
– EMA 200: $1.43
Price sits right on the 20-EMA, slightly above the 50-EMA, and well above the 200-EMA.
What it implies: the micro-trend has cooled into a sideways phase within a broader intraday uptrend. This is typical consolidation after a move up and often precedes the next leg, either as continuation or as a short-term mean reversion.
RSI (Micro Momentum)
– RSI 14: 47.55
RSI is sitting near mid-range on the 15-minute chart.
What it implies: there is no immediate directional edge at this micro timeframe. Bulls are not overstretched and bears are not in control. Short-term price can break either way from here without needing a reset in momentum.
MACD (M15)
– MACD line: 0.00
– Signal line: 0.01
– Histogram: 0.00
The MACD is flat and drifting.
What it implies: 15-minute momentum has stalled, in line with the neutral RSI. This is a classic holding pattern, with the market waiting for new information or a liquidity event to choose the next small leg.
Bollinger Bands (M15)
– Middle band: $1.48
– Upper band: $1.49
– Lower band: $1.47
– Close: $1.47
Price is hugging the lower side of a very tight band structure.
What it implies: volatility on the 15-minute view has compressed. Such squeezes often lead to quick directional pops. With the broader intraday trend up, the burden of proof is slightly on the bears to break this structure down; otherwise, a small upside expansion is more likely.
ATR (M15 Volatility)
– ATR 14: $0.01
Micro volatility is extremely low, roughly 0.7% moves on this timeframe.
What it implies: price is coiling. Any breakout from this tight range can travel multiple ATRs quickly relative to the recent baseline, which matters for execution and stop placement.
Market Context: Fearful Sentiment, But XRP Resilient
Broader crypto metrics show a total market cap around $2.58T with a 2.18% gain over 24h and a near doubling in volume. Bitcoin dominance sits around 56.8%, indicating that Bitcoin still anchors risk sentiment. Meanwhile, the fear and greed index is at 23 – Extreme Fear.
What it implies for XRP: price is holding firm and even grinding higher despite a fearful backdrop. That typically means buyers in XRP are relatively committed and dips can attract interest. At the same time, if the broader market sours again, the still-bearish higher timeframe structure could make XRP vulnerable to sharp pullbacks.
On the fundamental side, recent news of Ripple being valued at $50 billion after a $750 million share buyback adds a positive corporate narrative in the background. This does not dictate intraday price, but it helps explain why XRP might be seeing stickier support than some weaker altcoins.
Scenarios From Here
Bullish Scenario
In the bullish case, XRP holds above the $1.44–1.46 daily support band and continues to respect the 20-day EMA at $1.41. Intraday, the 1-hour EMAs at $1.45 and $1.43 act as buyable pullback zones.
Signs this path is playing out:
– 15-minute compression resolves upward, pushing price through $1.49–1.50 (daily R1 and upper H1 band).
– RSI on daily drifts from the mid-50s toward the low-60s while price reclaims and closes above the 50-day EMA (~$1.51).
– MACD on daily lifts further above the signal line and moves toward neutral or positive territory.
If XRP can turn the $1.49–1.51 area from resistance into support, the market starts to transition from bear market rally toward a potential trend change. That opens room toward prior swing supply zones above $1.55 and then higher, depending on broader market conditions.
What invalidates the bullish scenario?
A clean daily close below $1.41 (20-day EMA) would signal that the short-term uptrend has broken. A faster warning would be H1 losing the 200-EMA (~$1.40) with follow-through selling and RSI rolling back to sub-50 on both H1 and D1.
Bearish Scenario
In the bearish case, XRP fails to gain traction above $1.49–1.51, and the current push above the daily upper Bollinger Band proves to be an overextension.
Signs this path is playing out:
– 15-minute and 1-hour RSI roll back below 50 while price loses the $1.46 pivot and starts living under it.
– H1 price closes decisively below the 20- and 50-hour EMAs ($1.45 / $1.43) and begins testing the 200-EMA (~$1.40).
– On daily, a return inside the Bollinger Bands with follow-through selling takes price back toward the mid-band near $1.39.
If the market breaks and holds below $1.39–1.41, the move looks less like a dip and more like a resumption of the broader downtrend, with $1.32 (daily lower band) as a logical next downside reference.
What invalidates the bearish scenario?
If XRP can post multiple sessions closing above $1.51 with daily RSI holding above 55–60 and MACD continuing to improve, the argument for renewed bearish control weakens significantly. Bears need to keep price capped under that 50-day EMA to maintain the upper hand on the larger timeframe.
Positioning, Risk, and Uncertainty
Ripple price today is wedged between a confident intraday uptrend and a still-uncertain higher timeframe backdrop. Short-term traders are clearly leaning bullish, but the market as a whole remains fearful and aware that the broader crypto cycle has not fully normalized.
For positioning, the key is timeframe alignment:
– Intraday traders will focus on the 1-hour structure: holding above $1.45–1.43 keeps the path of least resistance higher.
– Swing traders should pay closer attention to the daily levels: $1.41 (20-EMA), $1.39 (mid-band), and especially $1.51 (50-EMA) as the line between bounce and trend transition.
Volatility is currently moderate across timeframes, which can change very quickly if broader market sentiment shifts out of extreme fear or if a new macro headline hits. Regardless of bias, this remains a market where traders need to respect invalidation levels and be prepared for volatility to expand from relatively calm conditions.
The bottom line: XRPUSDT holds a fragile bullish bias today, supported by short-term momentum but still constrained by the larger downtrend. The next decisive move hinges on whether price can convincingly clear and hold above the $1.49–1.51 zone or slips back under $1.44.
You May Also Like

Whales Dump 200 Million XRP in Just 2 Weeks – Is XRP’s Price on the Verge of Collapse?

Wall Street expert predicts 80% Tesla stock crash in 2026
