

CEA Industries (BNC) Stock: Dips 21% as $500M PIPE Filing Sparks Volatility
TLDR
- BNC stock plunges 21% as $500M PIPE filing sparks dilution fears.
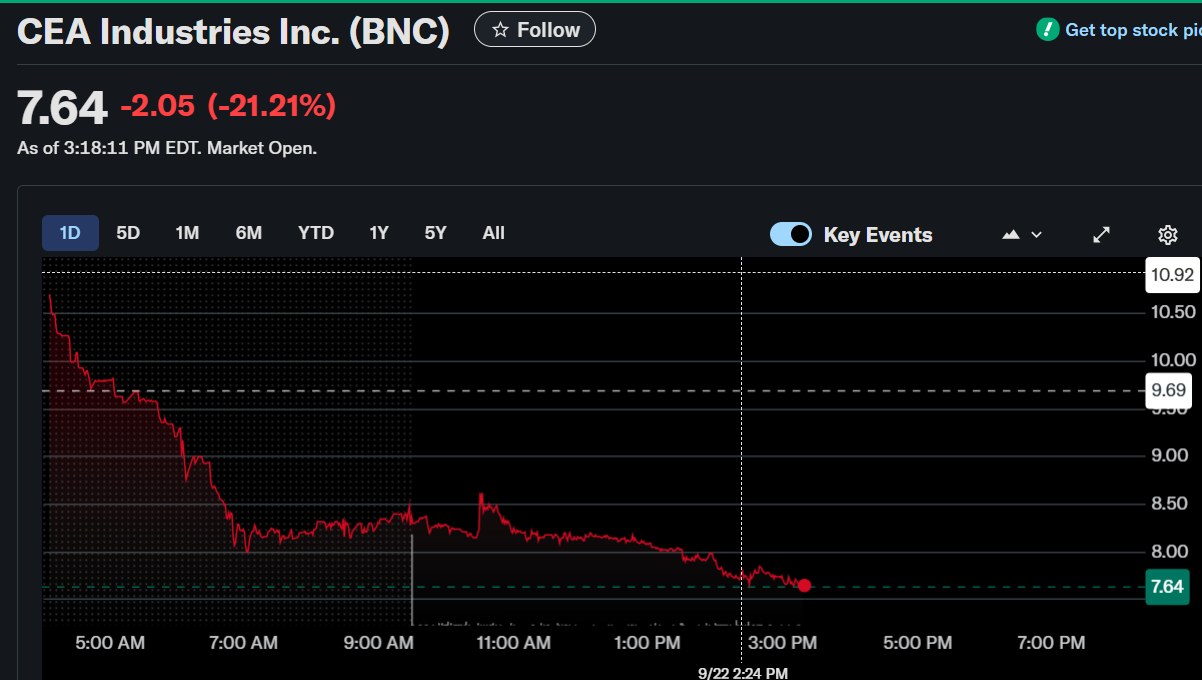
- CEA Industries’ $500M PIPE triggers sharp selloff, stock falls to $7.64.
- Investors dump BNC after $500M PIPE and $750M warrants disclosure.
- BNC slumps 21% as PIPE offering and dilution concerns grip markets.
- CEA’s treasury shift toward BNB hits shares after massive PIPE filing.
CEA Industries Inc. (Nasdaq: BNC) saw its stock drop sharply by 21.21% to $7.64 by 3:18 PM EDT.
CEA Industries Inc. (BNC)
The decline followed the company’s filing of a $500 million PIPE transaction under a new S-3 automatic registration. The filing marked a pivotal step in its ongoing treasury strategy centered on BNB accumulation.
BNC Stock Slumps After PIPE Disclosure
The sudden market reaction came as BNC disclosed its registration of $500 million in common equity for a PIPE offering. The company included up to $750 million in warrant transactions as part of the S-3 filing. The filing became effective immediately, allowing shares to begin trading without restrictive legends.
Market participants anticipated dilution and responded with selloffs throughout the day. Although the share structure includes warrants, each investor’s total share count appears doubled in disclosure tables. The transaction filing took place on Friday, September 19, with shares expected to reflect the changes starting Monday.
CEO David Namdar framed the filing as part of a broader capital strategy to expand BNB exposure. The company emphasized its vision of increasing BNB per share and capitalizing on mispricing. Namdar stated that BNC remains focused on transparency, with NAV indicators and dashboards planned for near-term release.
BNB at the Center of BNC’s Treasury Vision
BNB remains the foundation of BNC’s crypto-centric strategy, with the company comparing it to early Bitcoin adoption by corporate entities. BNC highlighted BNB’s significant year-to-date growth of 47.5% and its 35.6% climb since August 5. The company actively purchases BNB daily and holds additional reserves for expansion.
BNC underlined BNB’s unique advantages such as deflationary supply, widespread adoption, and long-term structural value. With over 250 million global users and thousands of applications, the BNB ecosystem continues to grow. Flagship apps like PancakeSwap and Aster demonstrate BNB’s expanding utility in decentralized markets.
The company cited BNB’s strong market position, with a $146 billion market cap, as the reason for its continued accumulation strategy and long-term focus. BNB surpasses Solana and is next targeted at XRP and Ethereum. BNC believes BNB offers strong yields and remains undervalued despite its current momentum.
Future Capital Deployment and Repurchase Plans
BNC recently announced a $250 million share repurchase plan to support share value. The buyback will target NAV discounts and increase BNB concentration per share. Volume limits and regulatory frameworks guide these repurchases.
BNC’s leadership brings deep experience in both crypto and traditional finance, which it says helps navigate volatile conditions. The company remains committed to its treasury-first approach and will continue adapting as markets evolve. It aims to establish itself as the premier public vehicle for BNB-focused capital exposure.
The post CEA Industries (BNC) Stock: Dips 21% as $500M PIPE Filing Sparks Volatility appeared first on CoinCentral.
You May Also Like

Michael Saylor: Bitcoin at 99% Discount, Will Hit $10M When Bankers Approve

Polymarket Shows 61% Chance Bitcoin Falls Below $100K Before 2026
