The methodology for sample selection, including filtering criteria for TESS Objects of Interest (TOIs) and cross-matching with Gaia DR3, is explained.The methodology for sample selection, including filtering criteria for TESS Objects of Interest (TOIs) and cross-matching with Gaia DR3, is explained.

How We Found Our Stars

2025/10/07 04:14

Abstract and 1 Introduction

  1. Sample selection and properties

  2. Results

  3. Discussion

  4. Concluding remarks and References

    Appendix A: Sample selection

    Appendix B: Properties of the TOIs in this work

    Appendix C: Pre-MS estimates

Appendix A: Sample selection

The description of the TOIs catalog is in Guerrero et al. (2021), but the updated list including 6977 TOIs[2] was taken as a departure point for selecting the sample. The previous list was initially filtered by only considering the sources that according with the TOIs catalog have: i) A light curve that is compatible with planetary transits (i.e., not rejected as false positives, not related with instrumental noise, or not classified as eclipsing binaries, with sources showing centroid offsets also discarded, stellar variables, or ambiguous planet candidates). ii) An orbital period of P < 10 days. For the few exceptions where two or more planets are associated to a given star, only the one with the shortest period was considered.

\ The resulting list was cross-matched with the Gaia DR3 catalog of astrophysical parameters produced by the Apsis processing (Creevey et al. 2023; Fouesneau et al. 2023). A radius of 1" was used to cross-match the TOIs and Gaia coordinates. A second filter was then applied, keeping the single sources that have: iii) Gaia DR3 values for L∗, M∗, and R∗. iv) An evolutionary status consistent with being in the MS (i.e., Gaia DR3 "evolution stage" parameter of ≤ 420). After the previous process, the initial number of TOIs is reduced by more than a factor of 3. Among the resulting list, 25 intermediate-mass stars with light curves having either a "confirmed planet" (CP) or "Kepler planet" (KP) status in the TOIs catalog were identified. These are all TOIs with Gaia DR3 masses > 1.5M⊙ and confirmed short-period planets (i.e., less massive than 13 MJup) currently identified in the Encyclopaedia of Exoplanetary Systems[3]. This sample was kept and the remaining intermediate-mass stars were further filtered as follows.

\
\ In addition, we selected the 298 low-mass stars with CP or KP status in the TOIs catalog and inferred planetary sizes compatible with giant, gas made planets similar to those around the intermediate-mass sample. This list results from the step iv described above, constituting all TOIs with Gaia DR3 masses ≤ 1.5 M⊙ and confirmed short-period planets, in accordance with the Encyclopaedia of Exoplanetary Systems.

\

Appendix B: Properties of the TOIs in this work

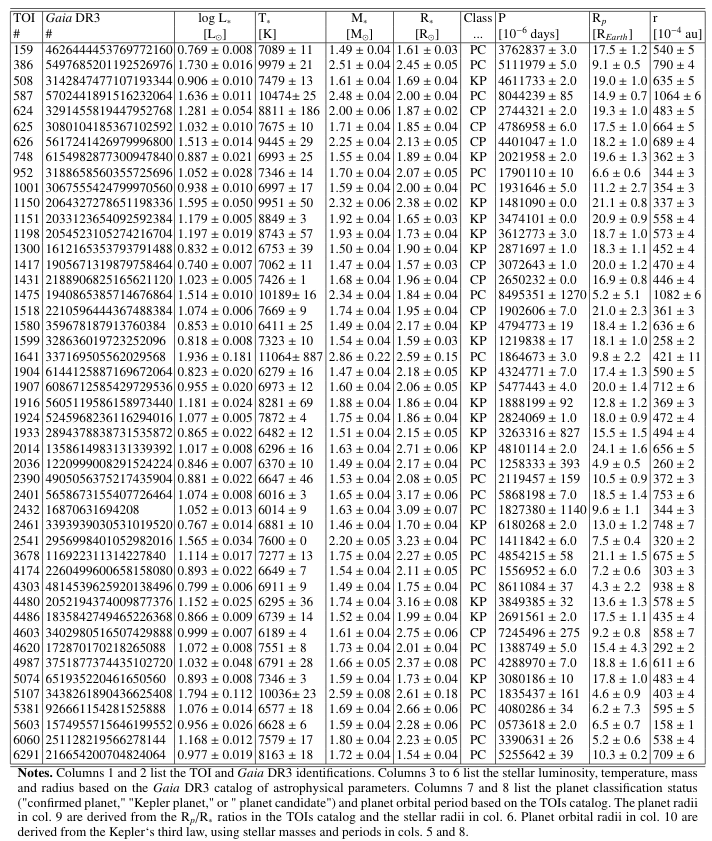
Table B.1 lists main parameters of the 47 TOIs with intermediate-mass stars analysed in this work. Values for the stellar luminosities, temperatures, masses and radii were taken from the Gaia DR3 catalog "I/355/paramp: 1D astrophysical parameters produced by the Apsis processing chain developed in Gaia DPAC CU8". Among the different estimates for the effective temperatures available in that catalog, we selected the ones derived from BP/RP spectra. The main reason for this selection is that such temperature estimates cover a larger sample of stars than the rest. In addition, we checked that relative errors are mostly < 10% when compared with effective temperatures derived from higher resolution spectra also available in that catalog. Errorbars for the stellar parameters refer to the lower (16%) and upper (84%) confidence levels listed in the Gaia DR3 catalog. The planet classification status come from the "EXOFOP disposition" column in the TOIs catalog, from which the orbital periods and errors were also taken. Planet radii were derived from the Rp/R∗ values in the TOIs catalog and the stellar radii in the Gaia DR3 catalog. The propagation of the corresponding uncertainties served to provide the final errorbars listed for the planet radii. Finally, orbital radii were derived from the Kepler’s third law assuming that the planet mass is negligible compared with the stellar mass. Errorbars come from the propagation of the uncertainties in the orbital periods from the TOIs catalog and in the stellar masses from the Gaia DR3 catalog.

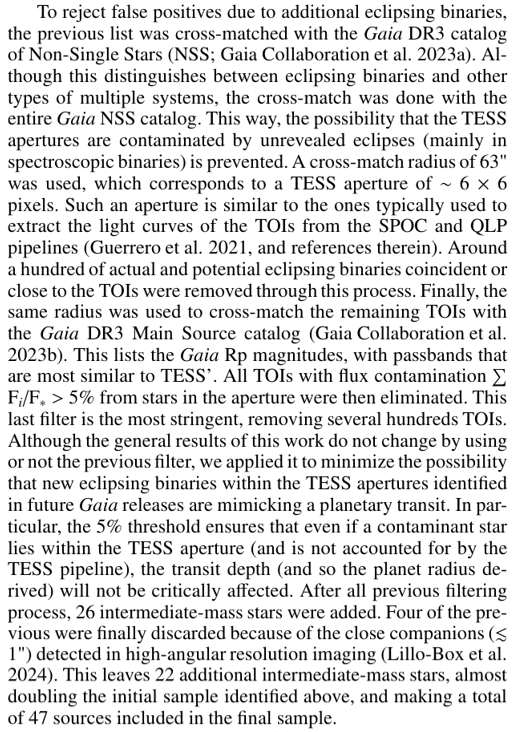
\ Figure B.1 shows the Hertzsprung-Russell (HR) diagram of the TOIs, adding to the intermediate-mass sample the 298 lowmass stars. All these host planets with CP and KP classification status (Appendix A) and are plotted in red. Planets without such a classification around intermediate-mass stars (22 out of 47) are represented with blue squares. We also plotted the lower and upper dashed lines representing the beginning and the end of the MS phase (for details about the MS evolution, see, e.g., Salaris & Cassisi 2006). In addition, pre-MS tracks and isochrones from Siess et al. (2000) are indicated for a representative set of stellar masses and ages (see Appendix C).

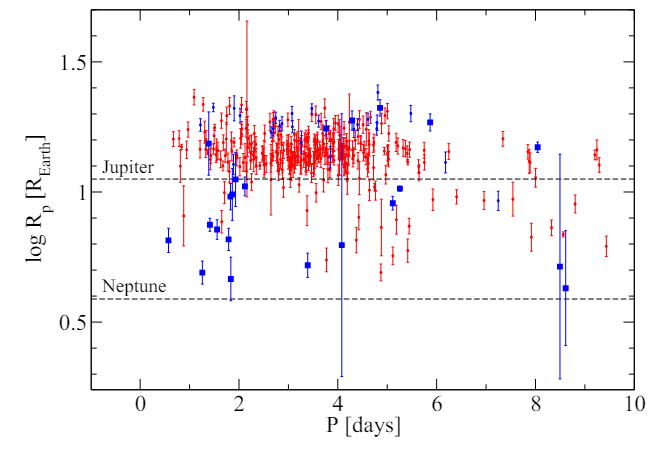
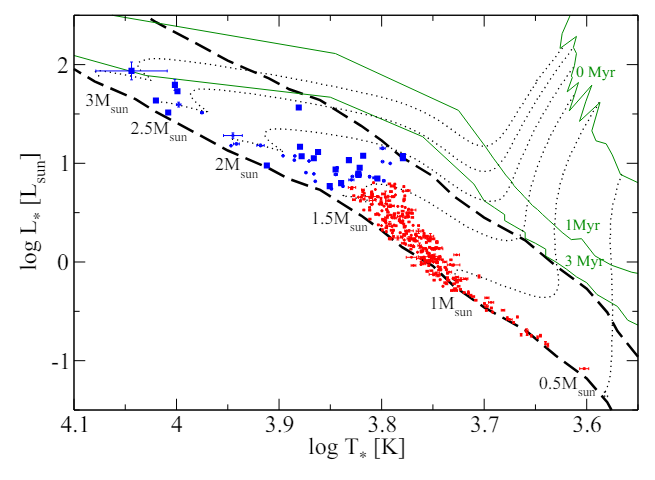
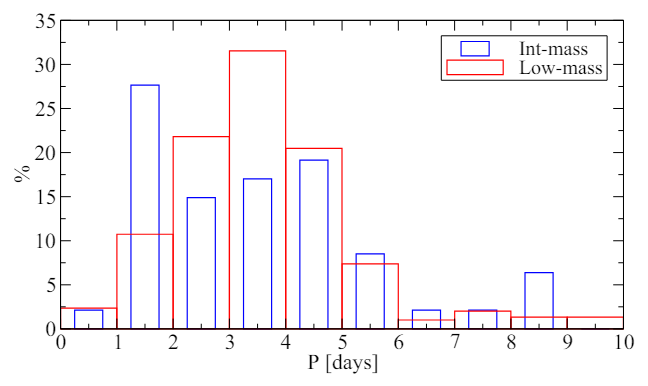
\ With respect to the properties of the planets, Fig. B.2 shows the planetary radii and orbital periods for the TOIs in the sample. Planets around intermediate-and low-mass stars, as well as their classification status, are again indicated. Planet sizes in between that of Neptune and a few Jupiter radii homogeneously distribute along the whole range of periods for the intermediate and low-mass samples. Figure B.3 compares the distribution of orbital periods around intermediate- and low-mass stars. Planets around intermediate-mass stars peak at 1-2 days, contrasting with the “three-day pileup” of the population of hot Jupiters around low-mass stars observed here and, in the literature, (e.g., Yee & Winn 2023, and references therein). Apart from this, the distributions of periods are similar for both stellar mass regimes. Indeed, a two-sample K-S test does not reject the null hypothesis

\ Fig. B.1: Stellar luminosity vs temperature for all TOIs in this work. Intermediate- and low-mass stars are in blue and red, respectively. Intermediate-mass stars hosting planets with candidate status in Table B.1 are indicated with squares. The evolution along the MS is bracketed by the dashed lines, the bottom line being the ZAMS and the top line the end of the MS phase. Representative pre-MS tracks (dotted lines with the corresponding stellar masses indicated) and isochrones at 0, 1 and 3 Myr (green solid lines) are also indicated.
\ Fig. B.2: Planetary radii vs orbital periods for intermediate- (blue) and low-mass (red) TOIs in the sample. Planets around intermediate-mass stars with candidate status in Table B.1 are indicated with squares. For reference, the horizontal lines show the Neptune and Jupiter radii.

\ that the orbital periods around intermediate- and low-mass stars are drawn from the same parent distribution, at a significance level given by p-value = 0.0957.

\ The similarity between the distributions of TESS planet sizes and periods explored in this work (Figs. B.2 and B.3) suggests that the intermediate- and low-mass stars samples are similarly affected by potential observational biases. Thus, such biases should not originate the differences between both samples reported here (see Sect. 3).

\ Fig. B.3: Distributions of planetary orbital periods. The intermediate- and low-mass samples are in blue and red, as indicated in the legend.
\ Table B.1: Sample of intermediate-mass stars

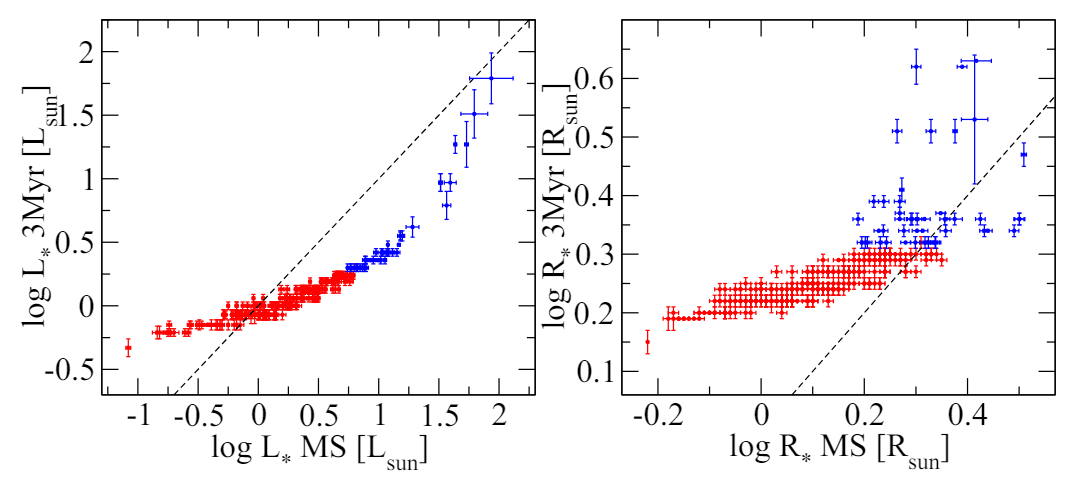
\ Fig. C.1: Stellar luminosities (left) and radii (right) during the MS are compared with those inferred at 3 Myr for the TOIs considered in this work. The dashed lines indicates equal values in both axes. Intermediate- and low-mass stars are in blue and red, respectively

\

Appendix C: Pre-MS estimates

The Siess et al. (2000) isochrones provide, for a given age and metallicity, the corresponding values of the stellar parameters L∗, R∗, T∗, and M∗. In turn, the pre-MS evolution in the HR diagram can be inferred, for a given value of M∗ and metallicity, from the Siess et al. (2000) evolutionary tracks. Based on the Gaia DR3 stellar masses, the pre-MS values of L∗ and R∗ were inferred for each star in our sample using the 3 Myr isochrone from Siess et al. (2000), assuming solar metallicity. This isochrone is plotted in Fig. B.1, along with several representative evolutionary tracks. From this graphical perspective, the pre-MS values for a given stellar mass are inferred from the point where the 3 Myr isochrone and the corresponding evolutionary track coincide. Figure C.1 compares the MS luminosities and radii from Gaia DR3 with those estimated during the pre-MS at 3 Myr. Errorbars in the y-axes reflect the uncertainties in the Gaia DR3 stellar masses used to infer the pre-MS values of L∗ and R∗ based on the isochrone, and also take into account the fact that bins of 0.1M⊙ were assumed to be interpolated.

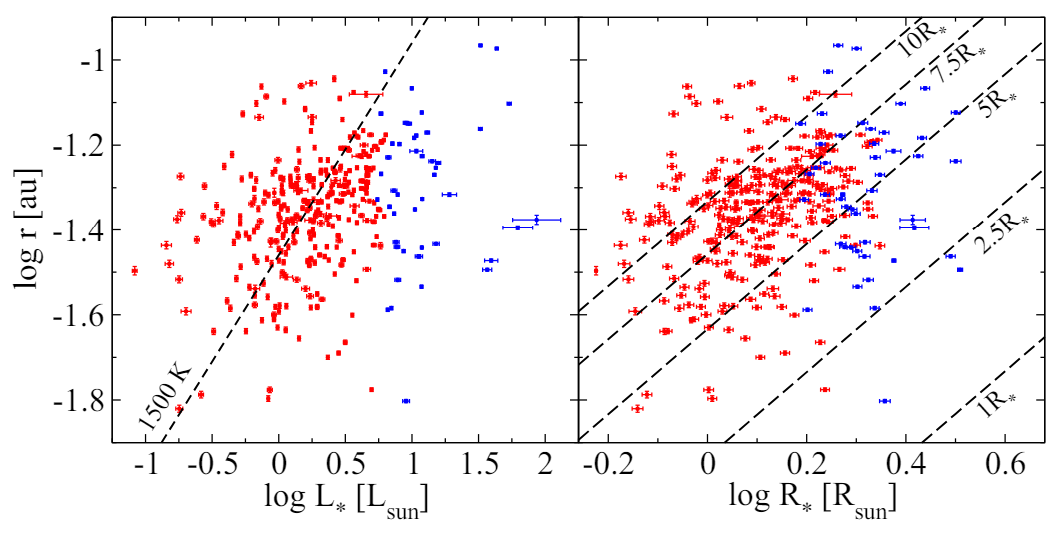
\ To estimate how disk dissipation timescales different than the typical 3 Myr affect our results and conclusions, we considered two cases. First, it was assumed that disk dissipation in intermediate-mass stars is faster than in low-mass stars. This difference has been suggested in earlier works indicating that disks around intermediate- and low-mass stars dissipate mostly at ∼ 1 Myr and ∼ 3 Myr, respectively (e.g., Ribas et al. 2015). The 1 Myr isochorne from Siess et al. (2000) is plotted in Figure B.1 along with the 3 Myr isochrone. For a typical intermediate-mass star with M∗ = 2M⊙, L∗ at 1 Myr is ∼ 0.2 dex larger than at 3 Myr. Because T∗ is slightly smaller at 1 Myr, R∗ at this age is larger by a factor ∼ 1.4 (0.1 dex) compared with that at 3 Myr. The net result is a slight displacement of the intermediate-mass stars to the right of both panels in Fig. 2, and to the left in Fig. 3. In other words, our conclusion that planetary orbits around intermediate-mass stars tend to be smaller than the dust-destruction radius and consistent with small magnetospheres would be reinforced under this scenario.

\

\ Fig. C.2: Planetary orbital radii versus MS stellar luminosities (left) and radii (right). Intermediate- and low-mass stars are in blue and red, respectively. In the left panel, the dashed line indicates the inner dust disk for a dust sublimation temperature of 1500 K. In the right panel, the dashed lines indicate the magnetospheric inner gas disk at 10, 7.5, 5, 2.5, and 1R∗.
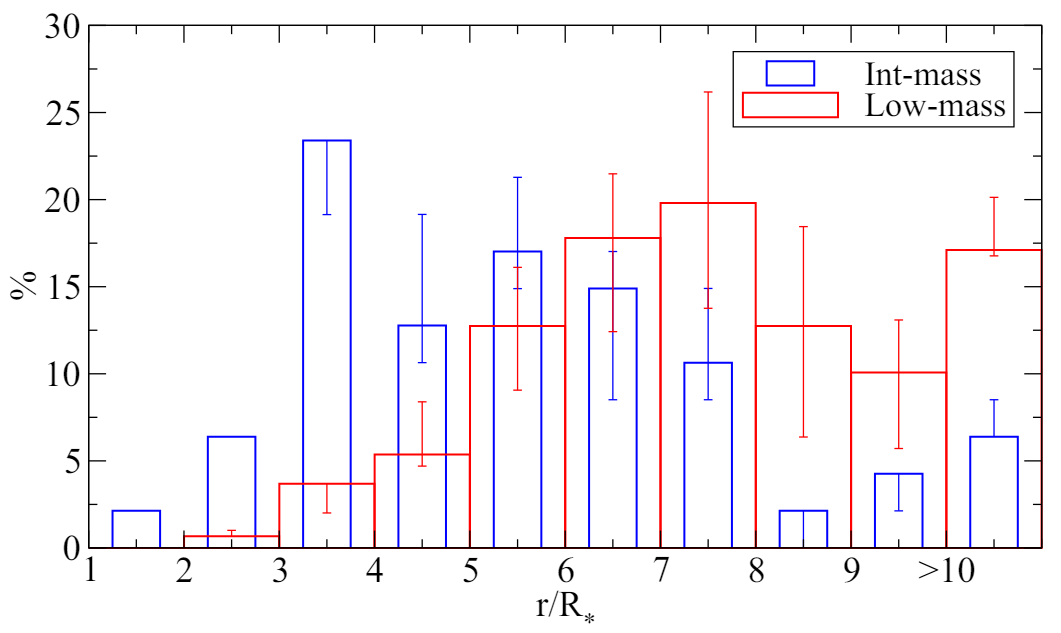
\ Fig. C.3: Distributions of planetary orbital radii in terms of of MS stellar radii. The intermediate- and low-mass samples are in blue and red, as indicated in the legend.

\ In addition, compared with the previously discussed changes of the disk dissipation timescale, the use of metallicities that are different than solar or evolutionary tracks and isochrones different to those in Siess et al. (2000) have a negligible effect on the pre-MS values inferred for L∗ and R∗ (see, e.g., Siess et al. 2000; Stassun et al. 2014).

\ In summary, although different assumptions to infer the stellar luminosities and radii during disk dissipation have an effect on their specific values and related statistics, the general results and conclusions of this work remain unaltered.

:::info Authors:

(1) I. Mendigutía, Centro de Astrobiología (CAB), CSIC-INTA, Camino Bajo del Castillo s/n, 28692, Villanueva de la Cañada, Madrid, Spain;

(2) J. Lillo-Box, Centro de Astrobiología (CAB), CSIC-INTA, Camino Bajo del Castillo s/n, 28692, Villanueva de la Cañada, Madrid, Spain;

(3) M. Vioque, European Southern Observatory, Karl-Schwarzschild-Strasse 2, D-85748 Garching bei München, Germany and Joint ALMA Observatory, Alonso de Córdova 3107, Vitacura, Santiago 763-0355, Chile;

(4) J. Maldonado, INAF – Osservatorio Astronomico di Palermo, Piazza del Parlamento 1, I-90134 Palermo, Italy;

(8) B. Montesinos, Centro de Astrobiología (CAB), CSIC-INTA, Camino Bajo del Castillo s/n, 28692, Villanueva de la Cañada, Madrid, Spain;

(6) N. Huélamo, Centro de Astrobiología (CAB), CSIC-INTA, Camino Bajo del Castillo s/n, 28692, Villanueva de la Cañada, Madrid, Spain;

(7) J. Wang, Departamento de Física Teórica, Módulo 15, Facultad de Ciencias, Universidad Autónoma de Madrid, 28049 Madrid, Spain.

:::


:::info This paper is available on arxiv under CC BY-SA 4.0 DEED license.

:::

[2] https://tev.mit.edu/data/

\ .[3] https://exoplanet.eu/home/

Disclaimer: The articles reposted on this site are sourced from public platforms and are provided for informational purposes only. They do not necessarily reflect the views of MEXC. All rights remain with the original authors. If you believe any content infringes on third-party rights, please contact service@support.mexc.com for removal. MEXC makes no guarantees regarding the accuracy, completeness, or timeliness of the content and is not responsible for any actions taken based on the information provided. The content does not constitute financial, legal, or other professional advice, nor should it be considered a recommendation or endorsement by MEXC.
Share Insights

You May Also Like

August Crypto Market Review: ETH Leads the Rise, Institutional Funding and Macro Factors Dominate Market Trends

August Crypto Market Review: ETH Leads the Rise, Institutional Funding and Macro Factors Dominate Market Trends

By Jianing Wu , Galaxy Digital Compiled by Tim, PANews August saw various crossover signals between the macro economy and the crypto market. In traditional markets, investors faced conflicting inflation signals: the CPI released at the beginning of the month came in below expectations, but the subsequent Producer Price Index (PPI) came in above expectations. This was coupled with weakening employment data and growing market expectations that the Federal Reserve would begin cutting interest rates in September. At the end of the month's Fed meeting in Jackson Hole, Wyoming, Chairman Powell struck a dovish tone, emphasizing the "shifting balance of risks" brought about by rising unemployment, which reinforced expectations of a shift toward easing monetary policy. The stock market closed higher in a volatile session, with the S&P 500 fluctuating with the data releases. Defensive assets like gold outperformed at the end of the month. The crypto market reflected this macro uncertainty, with increased volatility. Bitcoin hit an all-time high of over $124,000 in mid-August before retreating to around $110,000, while Ethereum's gains for the entire month outpaced Bitcoin's. After experiencing its largest single-day outflow at the beginning of the month, Ethereum ETFs quickly attracted strong inflows, briefly surpassing Bitcoin's despite Ethereum's smaller market capitalization. However, the recovery in demand pushed ETH prices to a new high near $4,953, and the ETH/BTC exchange rate rose to 0.04 for the first time since November 2024. The fluctuations in ETF trading highlight that institutional position adjustments are increasingly influencing price trends, and ETH is clearly the leader in this cycle. In terms of laws and policies, regulators are gradually pushing forward reforms to reshape the industry landscape. The U.S. Department of Labor has opened the door to allocating crypto assets to 401(k) pension plans, while the U.S. SEC has explicitly stated that certain liquidity pledge businesses do not fall under the category of securities. Application trends at the market structure and institutional levels are deepening. Treasury Secretary Bessant disclosed for the first time that strategic Bitcoin reserves now hold between 120,000 and 170,000 coins, revealing the government's cumulative cryptocurrency holdings for the first time. Business activity is also accelerating: Stablecoin issuers Stripe and Circle announced plans to develop independent L1 blockchains, while Wyoming became the first state government in the US to issue a dollar-denominated stablecoin. Google also joined the enterprise blockchain fray with its "Universal Ledger" system. Meanwhile, crypto treasury companies continue to increase their asset allocation efforts. Overall, August reinforced two key trends. On the one hand, macro volatility and policy uncertainty triggered significant market volatility in both the equity and crypto markets; on the other, the underlying trend of market institutionalization is accelerating, from ETF flows to widespread adoption by sovereign institutions and corporations. These intertwining forces are likely to continue to dominate market movements as the autumn approaches, with the Federal Reserve's policy shift and ongoing structural demand likely setting the tone for the next phase of the cycle. 1. Spikes, Breakouts, and Reversals In the first half of August, Ethereum led the market, outperforming Bitcoin and driving a broad rally in altcoins. The Bloomberg Galaxy Crypto Index shows that Bitcoin hit an all-time high of $124,496 on August 13 before reversing course, closing the month at $109,127, down from $116,491 at the beginning of the month. A week later, on August 22, Ethereum broke through the previous cycle high, reaching $4,953, surpassing the November 2021 high of $4,866 and ending a four-year consolidation. Ethereum's strong performance is particularly noteworthy given its underperformance for much of this cycle. Since its April low near $1,400, the price of Ether has more than tripled, driven by strong ETF flows and purchases by crypto treasury firms. U.S. spot Ethereum ETFs saw net inflows of approximately $4 billion in August, the second-strongest month after July. In contrast, U.S. spot Bitcoin ETFs saw net outflows of approximately $639 million. However, despite a price decline in the last two weeks of August, Bitcoin ETF inflows turned positive. As market expectations for aggressive interest rate cuts from the Federal Reserve grew, Bitcoin's store-of-value narrative regained focus. As the likelihood of a rate cut increased, Bitcoin's correlation with gold strengthened significantly that month. Besides ETFs, crypto treasury firms remain a significant source of demand. These firms continued to increase their holdings throughout August, with Ethereum-focused treasuries in particular injecting significant capital. Because Ethereum's market capitalization is smaller than Bitcoin's, corporate capital inflows have a disproportionate impact on spot prices. A $1 billion allocation to Ethereum can significantly impact the market landscape, far more than a similar amount allocated to Bitcoin. Furthermore, significant funds remain undeployed among publicly disclosed crypto treasury firms, suggesting further positive market conditions. The total cryptocurrency market capitalization climbed to a record high of $4.2 trillion that month, demonstrating the deep correlation between crypto assets and broader market trends. Rising expectations of interest rate cuts boosted risk appetite in both the stock and crypto markets, while ETF inflows and corporate reserve accumulation directly contributed to record highs for BTC and ETH. Despite market volatility near the end of the month, the interplay of loose macro policies, institutional capital flows, and crypto treasury reserve needs has maintained the crypto market's central position in the risk asset narrative. 2. Each company launches its own L1 public chain Favorable regulations are giving businesses more confidence to enter the crypto market directly. In late July, US SEC Chairman Paul Atkins announced the launch of "Project Crypto," an initiative aimed at promoting the on-chain issuance and trading of stocks, bonds, and other financial instruments. This initiative marks a key step in the integration of traditional market infrastructure with blockchain technology. Encouraged by this, businesses are breaking through the limitations of existing blockchain applications and launching their own Layer 1 networks. In August, three major companies announced the launch of new L1 blockchains. Circle launched Arc, which is compatible with the EVM and uses its USDC stablecoin as its native gas token. Arc features compliance and privacy features, a built-in on-chain foreign exchange settlement engine, and will launch with a permissioned validator set. Following its acquisitions of stablecoin infrastructure provider Bridge and crypto wallet service provider Privy, Stripe launched Tempo Chain, also compatible with the EVM and focused on stablecoin payments and enterprise applications. Google released the Google Cloud Universal Ledger (GCUL), a private permissioned blockchain focused on payments and asset issuance. It supports Python-based smart contracts and has attracted CME Group as a pilot partner. The logic behind enterprise blockchain development boils down to value capture, control, and independent design. By owning the underlying protocol, companies like Circle avoid paying network fees to third parties and profit directly from transaction activity. Stripe, on the other hand, can more tightly integrate its proprietary blockchain with payment systems, developing new features for customers without relying on the governance mechanisms of other chains. Both companies view control as a key element of compliant operations, particularly as regulators increase their scrutiny of illicit financial activities. Choosing to build on L1 rather than L2 avoids being constrained by other blockchain networks in terms of settlement or consensus mechanisms. Reactions from the crypto-native community have been mixed. Many believe that projects like Arc and GCUL, while borrowing technical standards from existing L1 chains, are inferior in design and exclude Ethereum and other native assets. Critics point out that permissioned validators and corporate-led governance models undermine decentralization and user autonomy. These debates echo the failed wave of "enterprise blockchains" in the mid-2010s, which ultimately failed to attract real users. Despite skepticism, these companies' moves are significant. Stripe processes over $1 trillion in payments annually, holding approximately 17% of the global payment processing market. If Tempo can achieve lower costs or offer better developer tools, competitors may be forced to follow suit. Google's entry demonstrates that major tech companies view blockchain as the next evolutionary level of financial infrastructure. If these companies can bring their scale, distribution capabilities, and regulatory resources to this area, the impact could be profound. In addition to businesses launching their own Layer 1 chains, other developments reinforce the trend of economic activity migrating on-chain. U.S. Secretary of Commerce Lutnick announced that GDP data will be published on public blockchains via oracle networks such as Chainlink and Python. Galaxy tokenized its shares to test on-chain secondary market trading. These initiatives demonstrate that businesses and governments are beginning to embed blockchain technology into core financial and data infrastructure, despite ongoing debate over the appropriate balance between compliance and decentralization. 3. Hot Trend: Crypto Treasury Companies The crypto treasury trends we highlighted in our earlier report continue. Bitcoin, Ethereum, and Solver (SOL) holdings continue to accumulate, with Ethereum showing the strongest performance. Holdings data shows a sharp rise in ETH's crypto treasury throughout August, primarily driven by Bitmine's reserves, which increased from approximately 625,000 ETH at the beginning of August to over 2 million currently. Solver holdings also maintained steady growth, while BTC holdings continued their slower but steady accumulation. Compared to ETF fund flows, the activity of crypto treasury companies appears relatively flat. In July and August, ETF fund inflows were stronger than those of crypto treasury companies, and the cumulative balance of ETFs also exceeded the cumulative size of crypto treasury companies. This divergence is becoming increasingly apparent as premiums on crypto treasury stocks shrink across the board. Earlier this summer, price-to-earnings ratios for crypto treasury companies were significantly higher than their net asset values, but these premiums have gradually returned to more normal levels, signaling a growing caution among stock market investors. The stock price fluctuations are evident: KindlyMD (Nakamoto's parent company) has fallen from a peak of nearly $25 in late May to around $5, while Bitmine has fallen from $62 in early August to around $46. Selling pressure intensified in late August amid reports that Nasdaq may tighten its oversight of acquisitions of crypto treasury companies through stock offerings. This news accelerated the sell-off in shares of Ethereum-focused crypto treasury companies. Bitcoin-focused companies, such as Strategy (formerly MicroStrategy, ticker symbol: MSTR), were less affected because their acquisition strategies rely more on debt financing than equity issuance. 4. Hot Trend: Copycat Season Another hot trend is the rotation into altcoins. Bitcoin's dominance has gradually declined, from approximately 60% at the beginning of August to 56.5% by the end of the month, while Ethereum's market share has risen from 11.7% to 13.6%. Data indicates a rotation out of Bitcoin into Ethereum and other cryptocurrencies, which aligns with the outperformance of Ethereum ETFs and inflows into crypto treasury firms. While Bitcoin ETF inflows have rebounded in recent weeks, the overall trend remains unchanged: this cycle continues to expand beyond Bitcoin, with Ethereum and altcoins gaining incremental market share. 5. Our views and predictions As markets head into the final weeks of September, all eyes are on the Federal Reserve. Labor market weakness is solidifying expectations of a near-term rate cut and reinforcing risk assets. The jobs report underscores that the economic slowdown may be deeper than initially reported, raising questions about how much easing policy will be needed to cushion the economy. Meanwhile, the long end of the yield curve is flashing warning signs. Persistently high 10-year and 30-year Treasury yields reflect market concerns that inflation may be sticky and that fiscal pressures may ultimately force central banks to finance debt and spending through money printing. Expectations of short-term interest rate cuts are driving a rebound in risky assets, but the tug-of-war between short-term support from rate cuts and long-term concerns pushing yields and precious metals higher will determine the sustainability of this rebound. This conflicting dynamic has a direct impact on cryptocurrencies: Bitcoin's correlation with gold as a store of value and hedge is growing, while Ethereum and altcoins remain more sensitive to shifts in overall risk appetite.
Share
PANews2025/09/18 17:40